Data Quality as Code examples
Hi! Here you will find a couple of Jupyter notebook examples describing how to use OpenMetadata's Python SDK to run the data quality tests you already know directly from your ETLs.
We're using Docker to run OpenMetadata's stack locally. The jupyter notebooks in notebooks will be injected in the jupyter server so you can run the examples in that self-contained environment.
We're going to use the NYC Yellow Taxi Ride Data dataset for these examples. Using docker we will work on a Postgres database where we will load the initial data and run our ETL against it.
We will be working with these two files:
- Yellow Taxi Ride for September 2025 (link to parquet file)
- Taxi Zones Lookup (link to csv file)
Table of Contents
- Setup
- Running Data Quality tests for tables in OpenMetadata
- Running Data Quality tests for pandas DataFrames
Setup
The initial setup will require that you run ./start [-v <version>]. It will fetch OpenMetadata's docker compose for the <version> release and will boot the full stack plus instances of jupyter and postgres for this tutorial.
Once the whole system is running, you can start following these instructions:
- Go to your OpenMetadata instance and login
- Email: admin@open-metadata.org
- Password: admin
- Create a database service to our Postgres Database
- Navigate to Databases (Settings -> Services -> Databases)

- Add a New Service
- Select Postgres
- Give it a name. We're using
Tutorial Postgresfor it. - Fill up the form with the following data:
- Username: tutorial_user
- Password: password
- Host And Port: dwh:5432
- Database: raw

- Configure the metadata ingestion to target only the metadata relevant to the tutorial

- Verify the ingestion is done and our
taxi_yellowtable appears in ourrawdatabase.
- Navigate to Databases (Settings -> Services -> Databases)
Now go back to the console where you ran ./start and check the logs. You should find a line saying "You can access jupyter instance at http://localhost:8888/?token=9e3bba6aba264fa8d4d476730f5fa1c03292598499d72513". Follow the link, and you'll be ready to move on to the next steps.
Running Data Quality tests for tables in OpenMetadata
In this example, we're going to run data quality tests against our taxi_yellow table from an ETL that simply takes the data from a parquet file in an S3 bucket and loads it into our raw database.
For this we will be working on the notebooks/test_workflows.ipynb notebook, which will be using the metadata.sdk.data_quality to showcase how we leverage OpenMetadata and the Python SDK to trigger test case workflows directly from the ETL.
The ultimate goal is to make every stakeholder an owner of the data quality. So while engineers just need to make sure their ETLs work, data stewards can update their Data Quality tests on the fly and have the ETL pick them up in the next run.
But first, let's make sure we have some tests in place. Follow these steps:
- Go to the table's
Data Observabilitytab and move toData Quality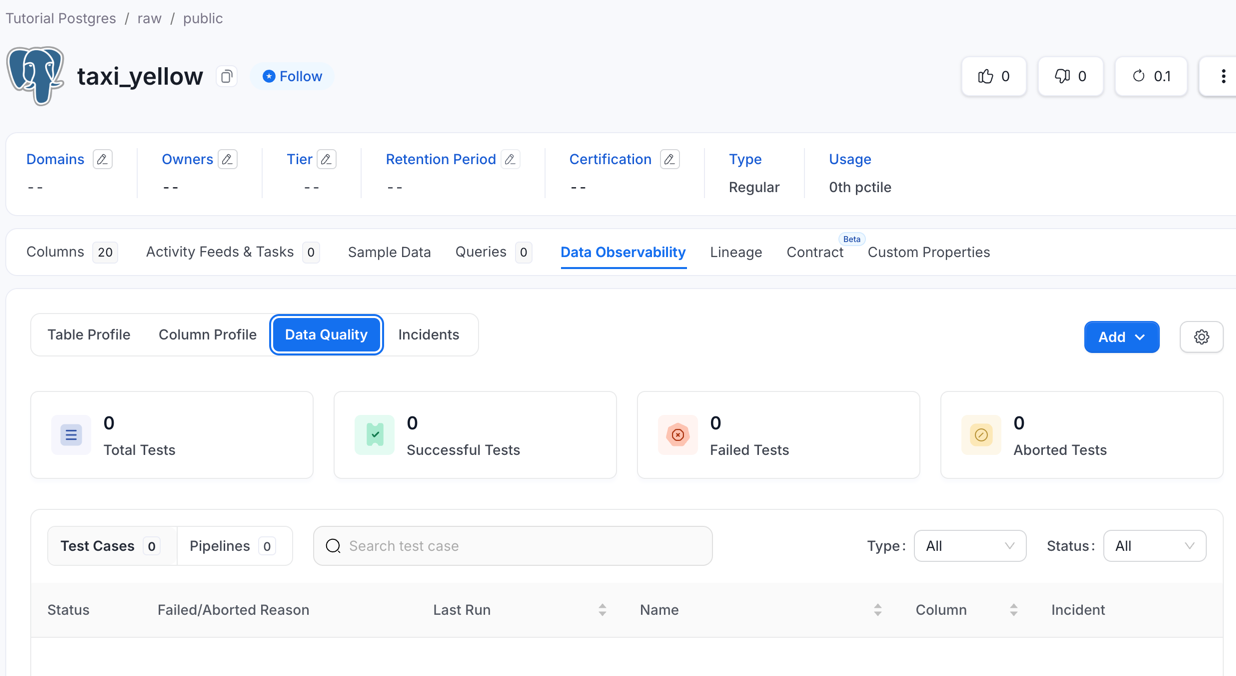
- Click on
Addand choose theTest Caseoption - Set up the test. The data we will be pushing to the table in each ETL run should have 10,000 rows. Let's set that up.
- Select
Table Row Count To Equalas Test Type - Set
Countto 10000 - Name the test
taxi_yellow_table_row_count_is_10000 - If prompted, scroll down to the pipeline section and click on the
On Demandbutton - Create it
- Select
- Let's add a couple more tests. Our ETL will keep taxi rides that start and end in a Yellow Zone location, so let's add tests that verify that
PUZoneandDOZoneequalYellow Zoneand nothing more:- Indicate the test should be performed at
Column Level - Select the column
PUZone - Select the test type
Column Values To Match Regex Pattern - Add the following RegEx Pattern:
^Yellow Zone$. - Create it and repeat for column
DOZone
- Indicate the test should be performed at
Check it out in Jupyter
Note
: the link above takes you to Jupyter running on localhost. It requires that you follow the previous steps and access Jupyter with the login token beforehand
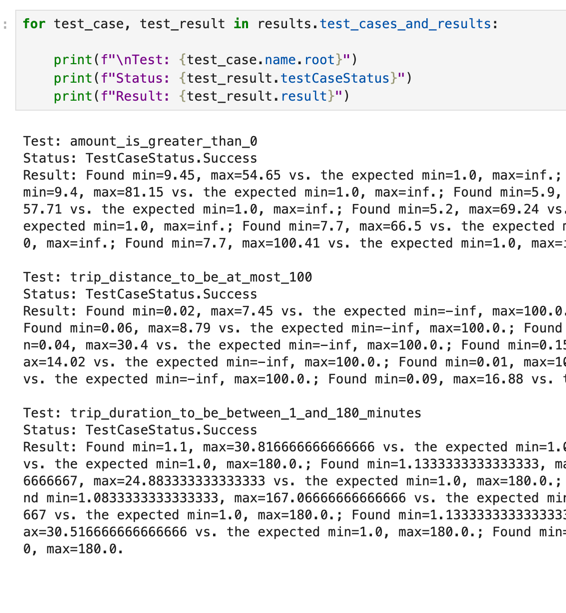
By the end of the notebook, you should have the following results:
Results
OpenMetadata page of the taxi_yellow data quality

Jupyter notebook with success reports for each test

Running Data Quality tests for pandas DataFrames
In this example we're going to use pandas to transform the data from the taxi_yellow table we prepared in the previous step.
For this we will be working on the notebooks/test_dataframe.ipynb notebook, which will be using the metadata.sdk.data_quality.dataframes package to showcase how we leverage OpenMetadata and the Python SDK to run validations right between transforming and loading data in our ETLs.
But first, let's make sure we have some tests in place. Follow these steps:
- Go to the table's
Data Observabilitytab and move toData Quality - Click on
Addand choose theTest Caseoption - Set up the first test. Let's make sure all rows have a
total_amountgreater than 0.- Indicate the test should be performed at
Column Level - Select
Column Values To Be Betweenas Test Type - Let's set a sensible minimum count of 1 and leave maximum blank
- Name the test
amount_is_greater_than_0 - If prompted, scroll down to the pipeline section and click on the
On Demandbutton - Create it
- Indicate the test should be performed at
- Let's add a test that ensures we're removing outliers in duration:
- Indicate the test should be performed at
Column Level - Select the column
trip_duration_min - Select the test type
Column Values To Be Between - Set 1 and 180 as minimum and maximum values.
- Name the test
trip_duration_to_be_between_1_and_180_minutes
- Indicate the test should be performed at
- Now let's do the same for outliers in distance:
- Indicate the test should be performed at
Column Level - Select the column
trip_distance - Select the test type
Column Values To Be Between - Leave
Minunfilled and set 100 asMax. - Name the test
trip_distance_to_be_at_most_100
- Indicate the test should be performed at
Check it out in Jupyter
By the end of the notebook, you should have the following results:
Results
OpenMetadata page of the dw_taxi_trips data quality

Jupyter notebook with success reports for each test