---
id: debug
title: "Debugging Tests"
---
The Playwright inspector is a great tool to help with debugging. It opens up a browser window highlighting the selectors as you step through each line of the test. You can also use the explore button to find other available [selectors](./selectors.md) which you can then copy into your test file and rerun your tests to see if it passes.
## Playwright Inspector
Playwright Inspector is a GUI tool that helps authoring and debugging Playwright scripts. That's our default recommended tool for scripts troubleshooting.
There are several ways of opening Playwright Inspector:
### Using --debug
* langs: js
- Debugging all Tests
```bash
npx playwright test --debug
```
- Debugging one test
```bash
npx playwright test example --debug
```
### Using PWDEBUG
Set the `PWDEBUG` environment variable to run your scripts in debug mode. This
configures Playwright for debugging and opens the inspector.
```bash tab=bash-bash lang=js
PWDEBUG=1 npm run test
```
```batch tab=bash-batch lang=js
set PWDEBUG=1
npm run test
```
```powershell tab=bash-powershell lang=js
$env:PWDEBUG=1
npm run test
```
```bash tab=bash-bash lang=java
# Source directories in the list are separated by : on macos and linux and by ; on win.
PWDEBUG=1 PLAYWRIGHT_JAVA_SRC= mvn test
```
```batch tab=bash-batch lang=java
# Source directories in the list are separated by : on macos and linux and by ; on win.
set PLAYWRIGHT_JAVA_SRC=
set PWDEBUG=1
mvn test
```
```powershell tab=bash-powershell lang=java
# Source directories in the list are separated by : on macos and linux and by ; on win.
$env:PLAYWRIGHT_JAVA_SRC=""
$env:PWDEBUG=1
mvn test
```
```bash tab=bash-bash lang=python
PWDEBUG=1 pytest -s
```
```batch tab=bash-batch lang=python
set PWDEBUG=1
pytest -s
```
```powershell tab=bash-powershell lang=python
$env:PWDEBUG=1
pytest -s
```
```bash tab=bash-bash lang=csharp
PWDEBUG=1 dotnet test
```
```batch tab=bash-batch lang=csharp
set PWDEBUG=1
dotnet test
```
```powershell tab=bash-powershell lang=csharp
$env:PWDEBUG=1
dotnet test
```
Additional useful defaults are configured when `PWDEBUG=1` is set:
- Browsers launch in the headed mode
- Default timeout is set to 0 (= no timeout)
Using `PWDEBUG=console` will configure the browser for debugging in Developer tools console:
* **Runs headed**: Browsers always launch in headed mode
* **Disables timeout**: Sets default timeout to 0 (= no timeout)
* **Console helper**: Configures a `playwright` object in the browser to generate and highlight
[Playwright selectors](./selectors.md). This can be used to verify text or
composite selectors.
```bash tab=bash-bash lang=js
PWDEBUG=console npm run test
```
```batch tab=bash-batch lang=js
set PWDEBUG=console
npm run test
```
```powershell tab=bash-powershell lang=js
$env:PWDEBUG="console"
npm run test
```
```bash tab=bash-bash lang=java
PWDEBUG=console mvn test
```
```batch tab=bash-batch lang=java
set PWDEBUG=console
mvn test
```
```powershell tab=bash-powershell lang=java
$env:PWDEBUG="console"
mvn test
```
```bash tab=bash-bash lang=python
PWDEBUG=console pytest -s
```
```batch tab=bash-batch lang=python
set PWDEBUG=console
pytest -s
```
```powershell tab=bash-powershell lang=python
$env:PWDEBUG="console"
pytest -s
```
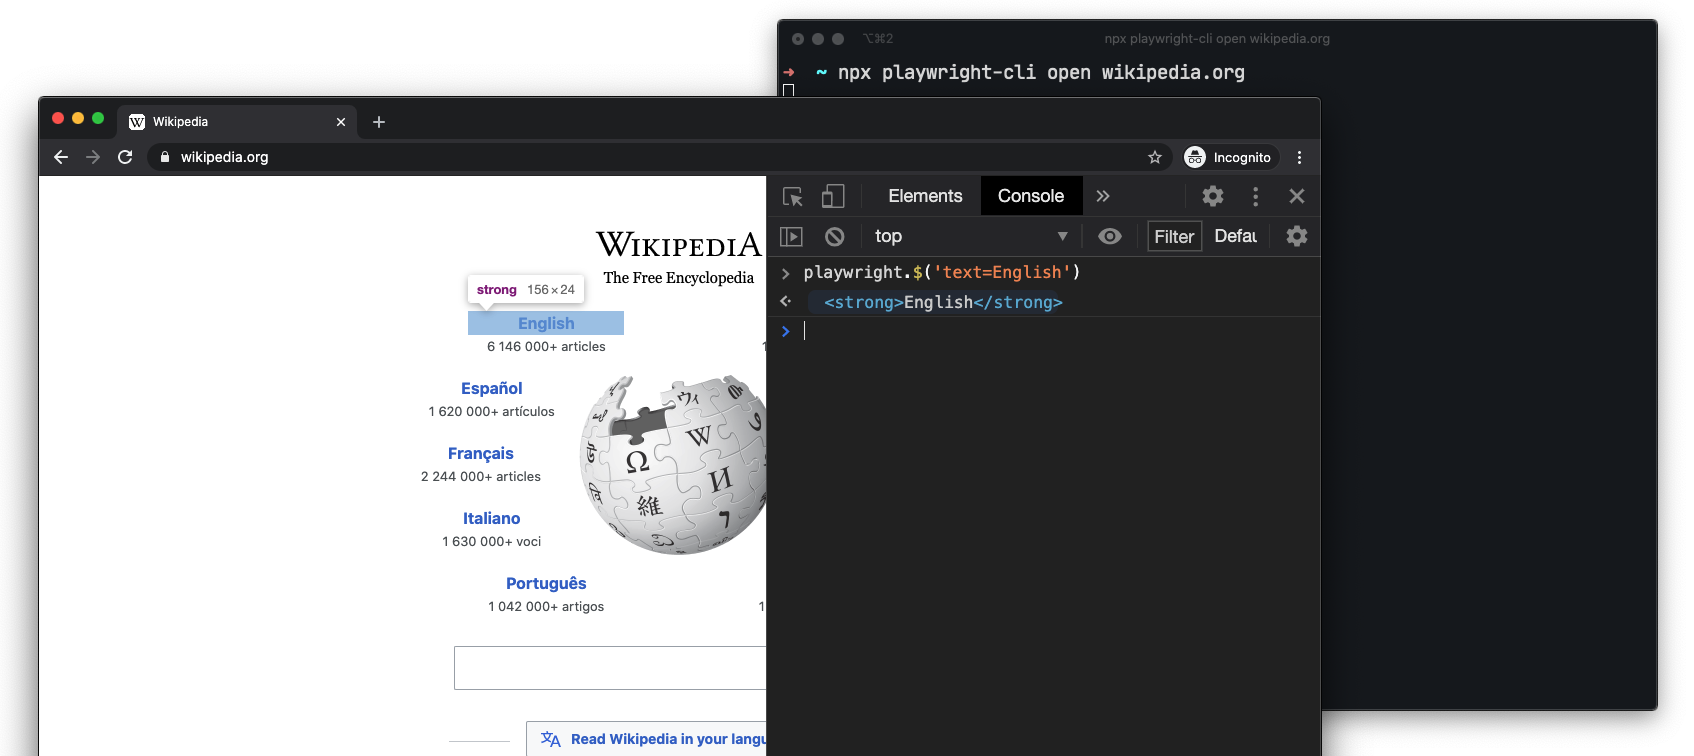
#### Selectors in Developer Tools Console
When running in Debug Mode with `PWDEBUG=console`, a `playwright` object is available in Developer tools console.
1. Run with `PWDEBUG=console`
1. Setup a breakpoint to pause the execution
1. Open the console panel in browser developer tools
1. Use the `playwright` API
* `playwright.$(selector)`: Highlight the first occurrence of the selector. This reflects
how `page.$` would see the page.
* `playwright.$$(selector)`: Highlight all occurrences of the selector. This reflects
how `page.$$` would see the page.
* `playwright.inspect(selector)`: Inspect the selector in the Elements panel.
* `playwright.locator(selector)`: Highlight the first occurrence of the locator.
* `playwright.clear()`: Clear existing highlights.
* `playwright.selector(element)`: Generate a selector that points to the element.
### Using page.pause
Call [`method: Page.pause`] method from your script when running in headed browser.
```js
// Pause on the following line.
await page.pause();
```
```java
// Pause on the following line.
page.pause();
```
```python async
# Pause on the following line.
await page.pause()
```
```python sync
# Pause on the following line.
page.pause()
```
```csharp
// Pause on the following line.
await page.PauseAsync();
```
- Use `open` or `codegen` commands in the Playwright [CLI](./cli.md):
```bash js
npx playwright codegen wikipedia.org
```
```bash java
mvn exec:java -e -Dexec.mainClass=com.microsoft.playwright.CLI -Dexec.args="codegen wikipedia.org"
```
```bash python
playwright codegen wikipedia.org
```
```bash csharp
pwsh bin\Debug\netX\playwright.ps1 codegen wikipedia.org
```
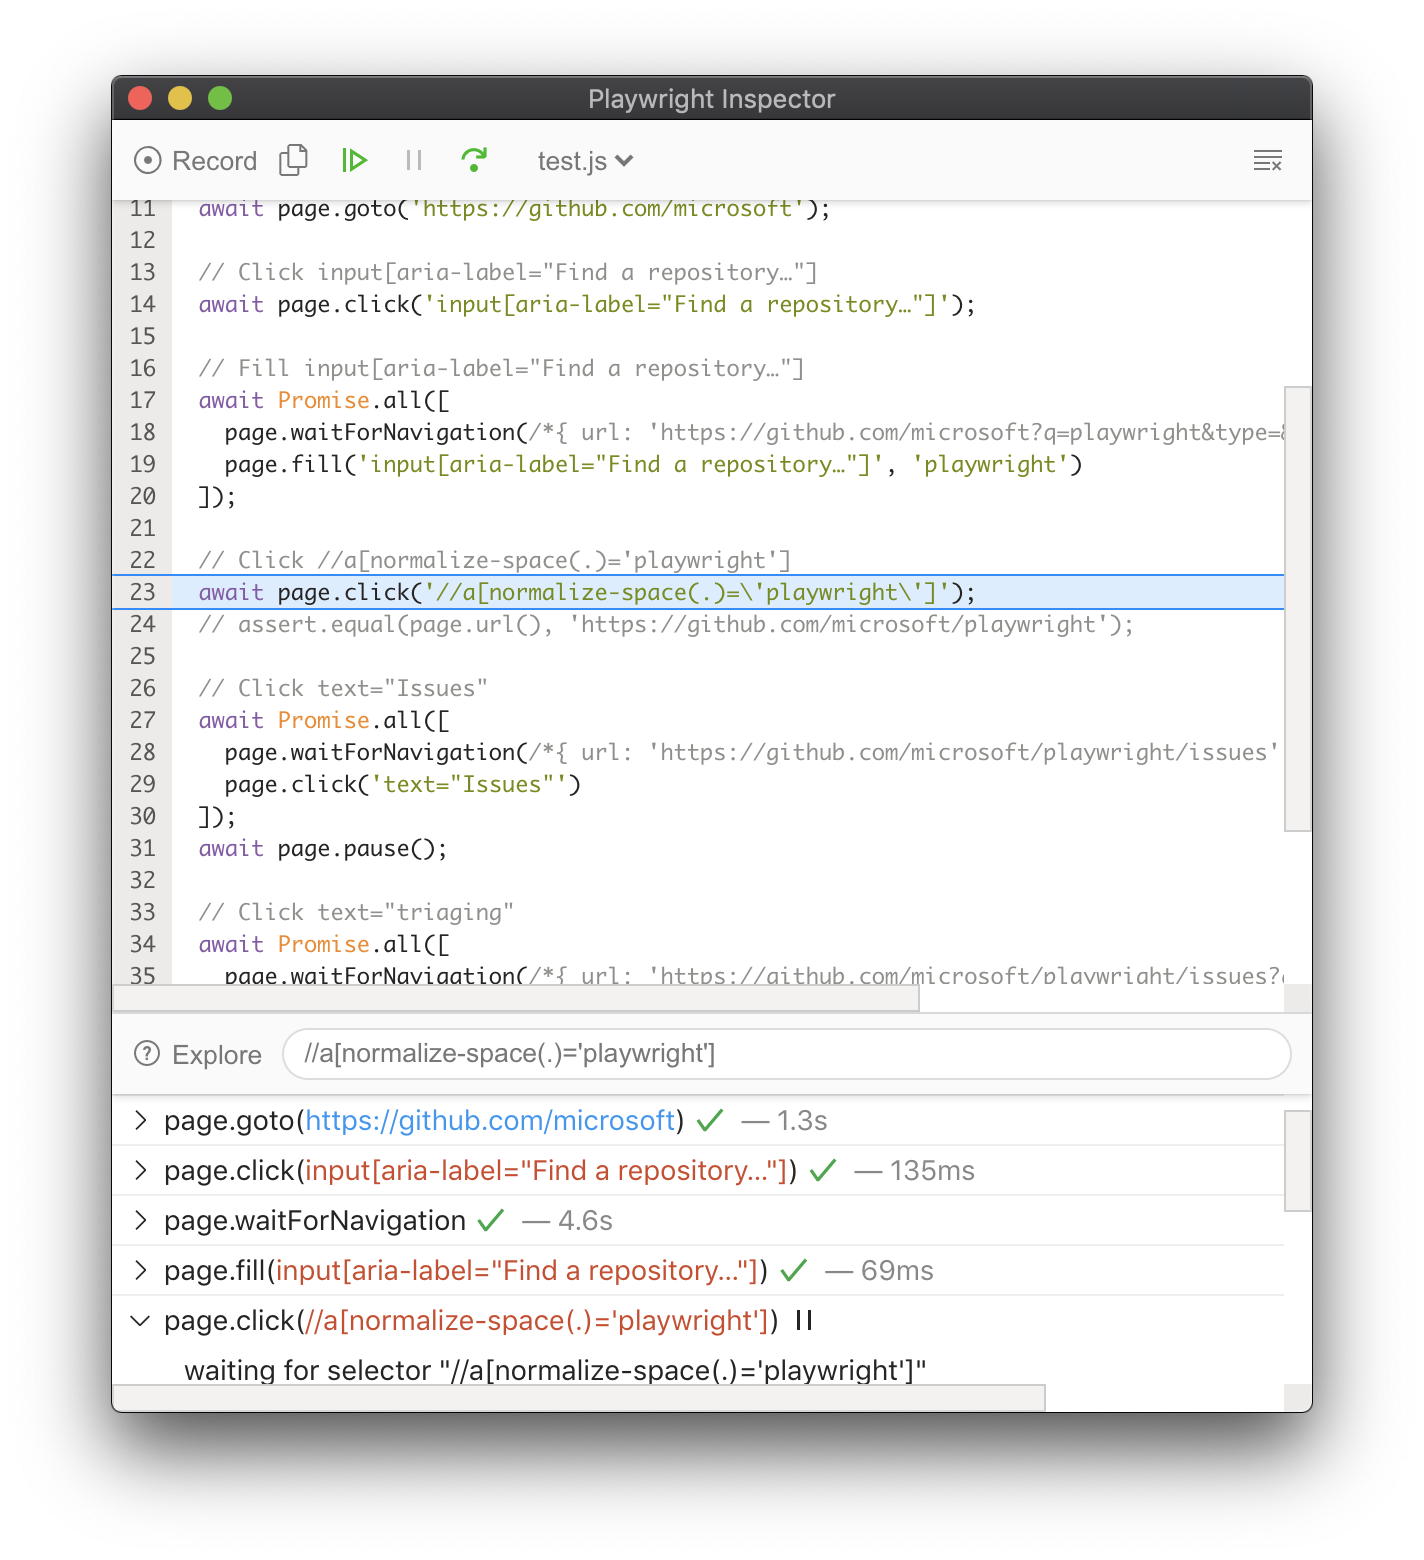
## Stepping through the Playwright script
When `PWDEBUG=1` is set, Playwright Inspector window will be opened and the script will be
paused on the first Playwright statement:
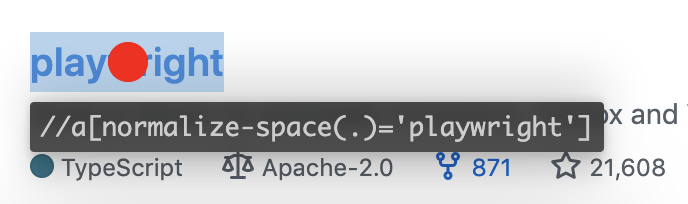
Now we know what action is about to be performed and we can look into the details on that
action. For example, when stopped on an input action such as `click`, the exact point Playwright is about to click is highlighted with the large red dot on the inspected page:
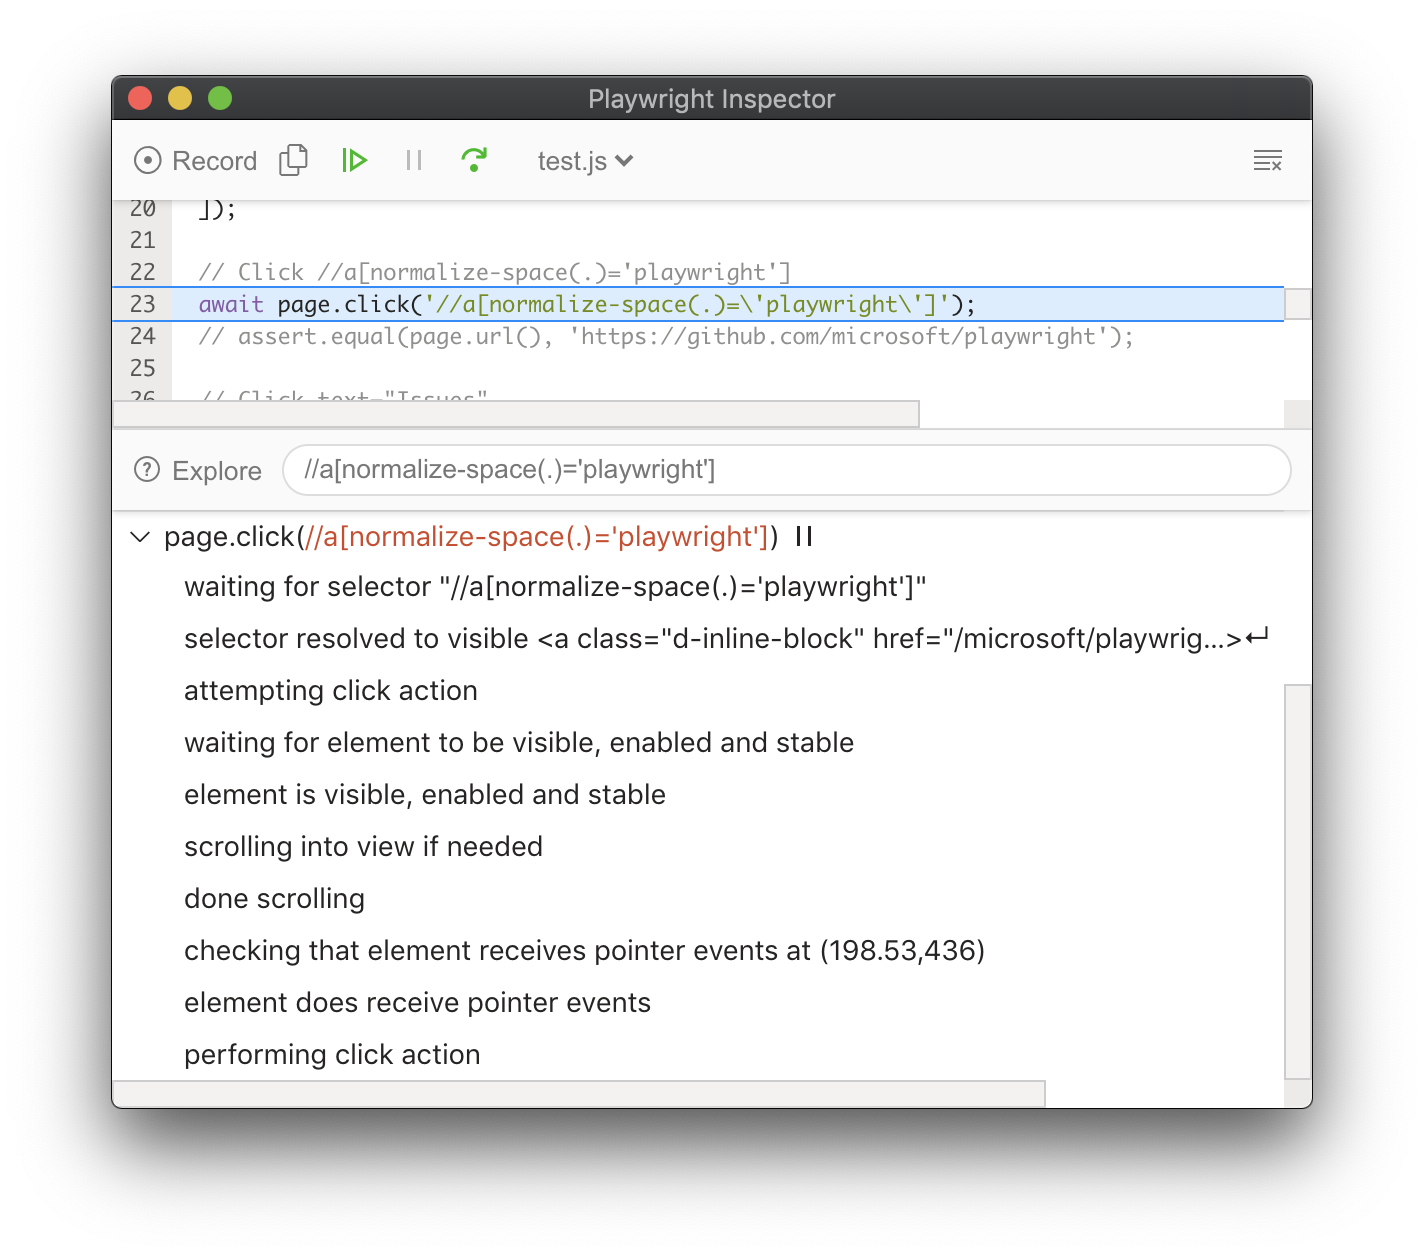
By the time Playwright has paused on that click action, it has already performed actionability checks that can be found in the log:
If actionability can't be reached, it'll show action as pending:
You can step over each action using the "Step over" action (keyboard shortcut: `F10`) or resume script without further pauses (`F8`):
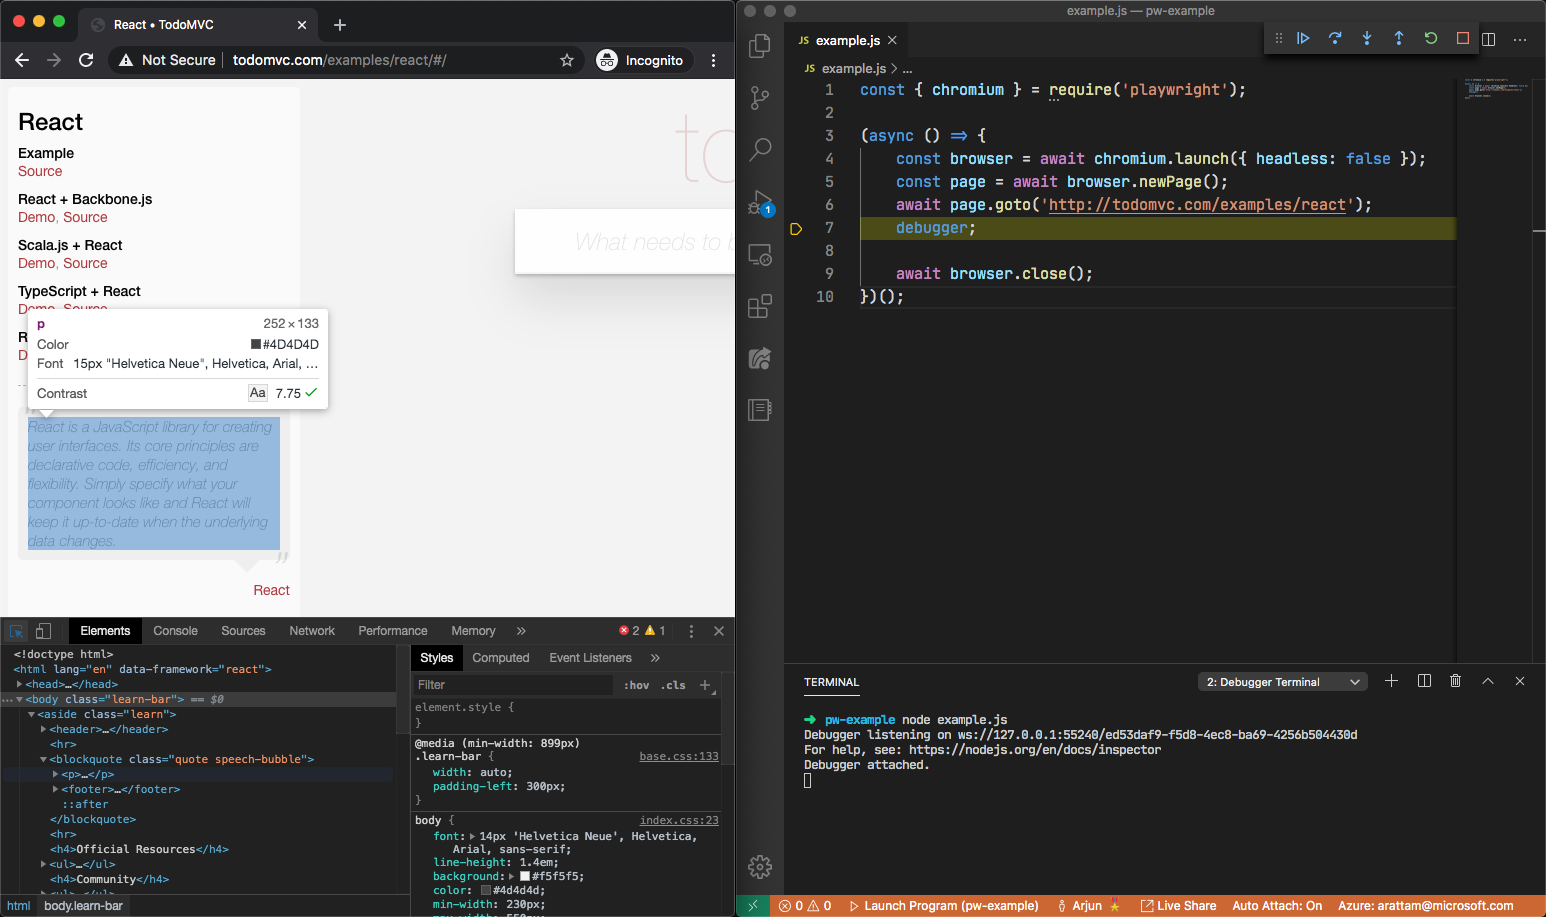
## Browser Developer Tools
You can use browser developer tools in Chromium, Firefox and WebKit while running
a Playwright script in headed mode. Developer tools help to:
* Inspect the DOM tree and **find element selectors**
* **See console logs** during execution (or learn how to [read logs via API](./api/class-page.md#page-event-console))
* Check **network activity** and other developer tools features
Using a [`method: Page.pause`] method is an easy way to pause the Playwright script execution
and inspect the page in Developer tools. It will also open [Playwright Inspector](./inspector.md) to help with debugging.
**For Chromium**: you can also open developer tools through a launch option.
```js
await chromium.launch({ devtools: true });
```
```java
chromium.launch(new BrowserType.LaunchOptions().setDevtools(true));
```
```python async
await chromium.launch(devtools=True)
```
```python sync
chromium.launch(devtools=True)
```
```csharp
await using var browser = await playwright.Chromium.LaunchAsync(new()
{
Devtools: true
});
```
:::note
**For WebKit**: launching WebKit Inspector during the execution will
prevent the Playwright script from executing any further.
:::
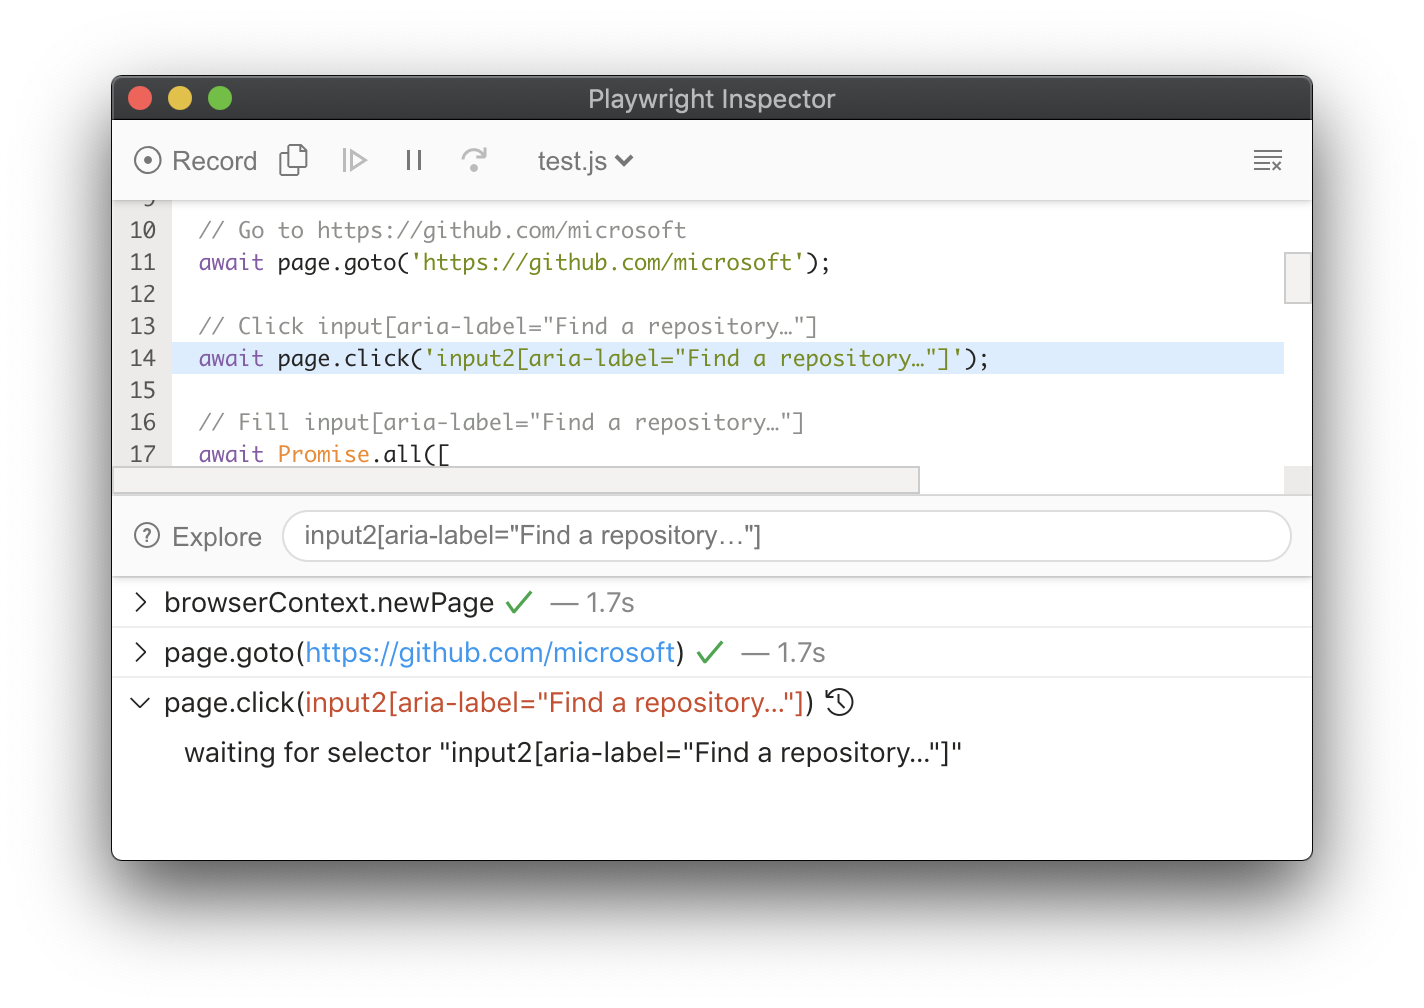
## Debugging Selectors
- Click the Explore button to hover over elements in the screen and click them to
automatically generate selectors for those elements.
- To verify where selector points, paste it into the inspector input field:
You can also use the following API inside the Developer Tools Console of any browser.
#### playwright.$(selector)
Query Playwright selector, using the actual Playwright query engine, for example:
```js
> playwright.$('.auth-form >> text=Log in');
```
#### playwright.$$(selector)
Same as `playwright.$`, but returns all matching elements.
```js
> playwright.$$('li >> text=John')
> [
,
,
,
]
```
#### playwright.inspect(selector)
Reveal element in the Elements panel (if DevTools of the respective browser supports it).
```js
> playwright.inspect('text=Log in')
```
#### playwright.locator(selector)
Query Playwright element using the actual Playwright query engine, for example:
```js
> playwright.locator('.auth-form', { hasText: 'Log in' });
> Locator ()
> - element: button
> - elements: [button]
```
#### playwright.selector(element)
Generates selector for the given element.
```js
> playwright.selector($0)
"div[id="glow-ingress-block"] >> text=/.*Hello.*/"
```
## Run Tests in headed mode
Playwright runs browsers in headless mode by default. To change this behavior,
use `headless: false` as a launch option. You can also use the [`option: slowMo`] option
to slow down execution and follow along while debugging.
```js
await chromium.launch({ headless: false, slowMo: 100 }); // or firefox, webkit
```
```java
chromium.launch(new BrowserType.LaunchOptions() // or firefox, webkit
.setHeadless(false)
.setSlowMo(100));
```
```python async
await chromium.launch(headless=False, slow_mo=100) # or firefox, webkit
```
```python sync
chromium.launch(headless=False, slow_mo=100) # or firefox, webkit
```
```csharp
// Chromium, Firefox, or Webkit
await using var browser = await playwright.Chromium.LaunchAsync(new()
{
Headless = false,
SlowMo = 100
});
```
## Verbose API logs
Playwright supports verbose logging with the `DEBUG` environment variable.
```bash tab=bash-bash lang=js
DEBUG=pw:api npm run test
```
```batch tab=bash-batch lang=js
set DEBUG=pw:api
npm run test
```
```powershell tab=bash-powershell lang=js
$env:DEBUG="pw:api"
npm run test
```
```bash tab=bash-bash lang=java
DEBUG=pw:api mvn test
```
```batch tab=bash-batch lang=java
set DEBUG=pw:api
mvn test
```
```powershell tab=bash-powershell lang=java
$env:DEBUG="pw:api"
mvn test
```
```bash tab=bash-bash lang=python
DEBUG=pw:api pytest -s
```
```batch tab=bash-batch lang=python
set DEBUG=pw:api
pytest -s
```
```powershell tab=bash-powershell lang=python
$env:DEBUG="pw:api"
pytest -s
```
```bash tab=bash-bash lang=csharp
DEBUG=pw:api dotnet run
```
```batch tab=bash-batch lang=csharp
set DEBUG=pw:api
dotnet run
```
```powershell tab=bash-powershell lang=csharp
$env:DEBUG="pw:api"
dotnet run
```
## What's Next
- [Generate tests with Codegen](./codegen.md)
- [See a trace of your tests](./trace-viewer.md)
 There are several ways of opening Playwright Inspector:
### Using --debug
* langs: js
- Debugging all Tests
```bash
npx playwright test --debug
```
- Debugging one test
```bash
npx playwright test example --debug
```
### Using PWDEBUG
Set the `PWDEBUG` environment variable to run your scripts in debug mode. This
configures Playwright for debugging and opens the inspector.
```bash tab=bash-bash lang=js
PWDEBUG=1 npm run test
```
```batch tab=bash-batch lang=js
set PWDEBUG=1
npm run test
```
```powershell tab=bash-powershell lang=js
$env:PWDEBUG=1
npm run test
```
```bash tab=bash-bash lang=java
# Source directories in the list are separated by : on macos and linux and by ; on win.
PWDEBUG=1 PLAYWRIGHT_JAVA_SRC=
There are several ways of opening Playwright Inspector:
### Using --debug
* langs: js
- Debugging all Tests
```bash
npx playwright test --debug
```
- Debugging one test
```bash
npx playwright test example --debug
```
### Using PWDEBUG
Set the `PWDEBUG` environment variable to run your scripts in debug mode. This
configures Playwright for debugging and opens the inspector.
```bash tab=bash-bash lang=js
PWDEBUG=1 npm run test
```
```batch tab=bash-batch lang=js
set PWDEBUG=1
npm run test
```
```powershell tab=bash-powershell lang=js
$env:PWDEBUG=1
npm run test
```
```bash tab=bash-bash lang=java
# Source directories in the list are separated by : on macos and linux and by ; on win.
PWDEBUG=1 PLAYWRIGHT_JAVA_SRC=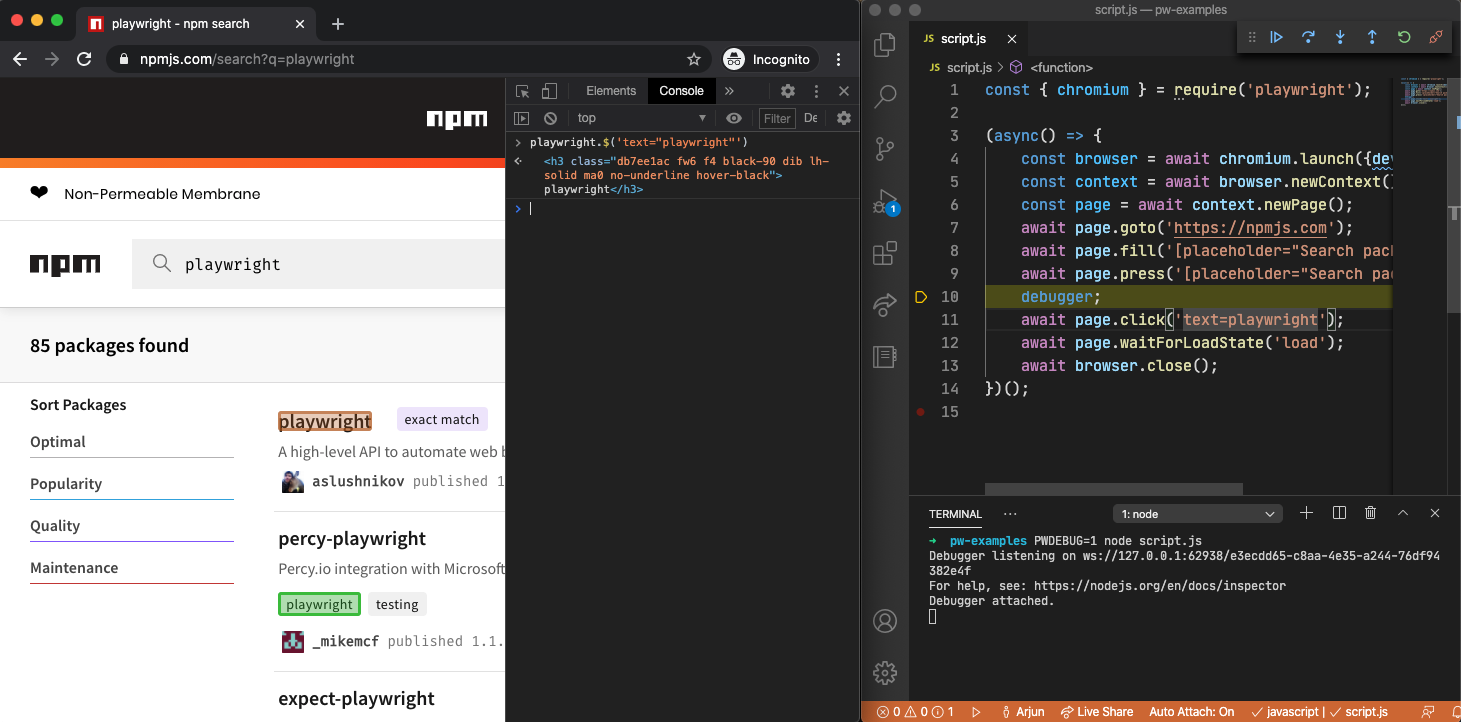 ### Using page.pause
Call [`method: Page.pause`] method from your script when running in headed browser.
```js
// Pause on the following line.
await page.pause();
```
```java
// Pause on the following line.
page.pause();
```
```python async
# Pause on the following line.
await page.pause()
```
```python sync
# Pause on the following line.
page.pause()
```
```csharp
// Pause on the following line.
await page.PauseAsync();
```
- Use `open` or `codegen` commands in the Playwright [CLI](./cli.md):
```bash js
npx playwright codegen wikipedia.org
```
```bash java
mvn exec:java -e -Dexec.mainClass=com.microsoft.playwright.CLI -Dexec.args="codegen wikipedia.org"
```
```bash python
playwright codegen wikipedia.org
```
```bash csharp
pwsh bin\Debug\netX\playwright.ps1 codegen wikipedia.org
```
## Stepping through the Playwright script
When `PWDEBUG=1` is set, Playwright Inspector window will be opened and the script will be
paused on the first Playwright statement:
### Using page.pause
Call [`method: Page.pause`] method from your script when running in headed browser.
```js
// Pause on the following line.
await page.pause();
```
```java
// Pause on the following line.
page.pause();
```
```python async
# Pause on the following line.
await page.pause()
```
```python sync
# Pause on the following line.
page.pause()
```
```csharp
// Pause on the following line.
await page.PauseAsync();
```
- Use `open` or `codegen` commands in the Playwright [CLI](./cli.md):
```bash js
npx playwright codegen wikipedia.org
```
```bash java
mvn exec:java -e -Dexec.mainClass=com.microsoft.playwright.CLI -Dexec.args="codegen wikipedia.org"
```
```bash python
playwright codegen wikipedia.org
```
```bash csharp
pwsh bin\Debug\netX\playwright.ps1 codegen wikipedia.org
```
## Stepping through the Playwright script
When `PWDEBUG=1` is set, Playwright Inspector window will be opened and the script will be
paused on the first Playwright statement:
 Now we know what action is about to be performed and we can look into the details on that
action. For example, when stopped on an input action such as `click`, the exact point Playwright is about to click is highlighted with the large red dot on the inspected page:
Now we know what action is about to be performed and we can look into the details on that
action. For example, when stopped on an input action such as `click`, the exact point Playwright is about to click is highlighted with the large red dot on the inspected page:
 By the time Playwright has paused on that click action, it has already performed actionability checks that can be found in the log:
 If actionability can't be reached, it'll show action as pending:
 You can step over each action using the "Step over" action (keyboard shortcut: `F10`) or resume script without further pauses (`F8`):

 Using a [`method: Page.pause`] method is an easy way to pause the Playwright script execution
and inspect the page in Developer tools. It will also open [Playwright Inspector](./inspector.md) to help with debugging.
**For Chromium**: you can also open developer tools through a launch option.
```js
await chromium.launch({ devtools: true });
```
```java
chromium.launch(new BrowserType.LaunchOptions().setDevtools(true));
```
```python async
await chromium.launch(devtools=True)
```
```python sync
chromium.launch(devtools=True)
```
```csharp
await using var browser = await playwright.Chromium.LaunchAsync(new()
{
Devtools: true
});
```
:::note
**For WebKit**: launching WebKit Inspector during the execution will
prevent the Playwright script from executing any further.
:::
## Debugging Selectors
- Click the Explore button to hover over elements in the screen and click them to
automatically generate selectors for those elements.
- To verify where selector points, paste it into the inspector input field:
Using a [`method: Page.pause`] method is an easy way to pause the Playwright script execution
and inspect the page in Developer tools. It will also open [Playwright Inspector](./inspector.md) to help with debugging.
**For Chromium**: you can also open developer tools through a launch option.
```js
await chromium.launch({ devtools: true });
```
```java
chromium.launch(new BrowserType.LaunchOptions().setDevtools(true));
```
```python async
await chromium.launch(devtools=True)
```
```python sync
chromium.launch(devtools=True)
```
```csharp
await using var browser = await playwright.Chromium.LaunchAsync(new()
{
Devtools: true
});
```
:::note
**For WebKit**: launching WebKit Inspector during the execution will
prevent the Playwright script from executing any further.
:::
## Debugging Selectors
- Click the Explore button to hover over elements in the screen and click them to
automatically generate selectors for those elements.
- To verify where selector points, paste it into the inspector input field:
 You can also use the following API inside the Developer Tools Console of any browser.
 #### playwright.$(selector)
Query Playwright selector, using the actual Playwright query engine, for example:
```js
> playwright.$('.auth-form >> text=Log in');
```
#### playwright.$$(selector)
Same as `playwright.$`, but returns all matching elements.
```js
> playwright.$$('li >> text=John')
> [
#### playwright.$(selector)
Query Playwright selector, using the actual Playwright query engine, for example:
```js
> playwright.$('.auth-form >> text=Log in');
```
#### playwright.$$(selector)
Same as `playwright.$`, but returns all matching elements.
```js
> playwright.$$('li >> text=John')
> [