---
id: inspector
title: "Inspector"
---
Playwright Inspector is a GUI tool that helps authoring and debugging Playwright scripts.
 ## Open Playwright Inspector
There are several ways of opening Playwright Inspector:
- Set the `PWDEBUG` environment variable to run your scripts in debug mode. This
configures Playwright for debugging and opens the inspector.
```sh js
# Linux/macOS
$ PWDEBUG=1 npm run test
# Windows
$ set PWDEBUG=1
$ npm run test
```
```sh java
# Linux/macOS
$ PWDEBUG=1 PLAYWRIGHT_JAVA_SRC= mvn test
# Windows
$ set PLAYWRIGHT_JAVA_SRC=
$ set PWDEBUG=1
$ mvn test
```
```sh python
# Linux/macOS
$ PWDEBUG=1 pytest -s
# Windows
$ set PWDEBUG=1
$ pytest -s
```
Additional useful defaults are configured when `PWDEBUG` is set:
- Browsers launch in the headed mode
- Default timeout is set to 0 (= no timeout)
- Call [`method: Page.pause`] method from your script when running in headed browser.
```js
// Pause on the following line.
await page.pause();
```
```java
// Pause on the following line.
page.pause();
```
```python async
# Pause on the following line.
await page.pause()
```
```python sync
# Pause on the following line.
page.pause()
```
- Use `open` or `codegen` commands in the Playwright [CLI](./cli.md):
```sh js
$ npx playwright codegen wikipedia.org
```
```sh java
$ mvn exec:java -e -Dexec.mainClass=com.microsoft.playwright.CLI -Dexec.args="codegen wikipedia.org"
```
```sh python
$ playwright codegen wikipedia.org
```
## Stepping through the Playwright script
When `PWDEBUG` is set, Playwright Inspector window will be opened and the script will be
paused on the first Playwright statement:
## Open Playwright Inspector
There are several ways of opening Playwright Inspector:
- Set the `PWDEBUG` environment variable to run your scripts in debug mode. This
configures Playwright for debugging and opens the inspector.
```sh js
# Linux/macOS
$ PWDEBUG=1 npm run test
# Windows
$ set PWDEBUG=1
$ npm run test
```
```sh java
# Linux/macOS
$ PWDEBUG=1 PLAYWRIGHT_JAVA_SRC= mvn test
# Windows
$ set PLAYWRIGHT_JAVA_SRC=
$ set PWDEBUG=1
$ mvn test
```
```sh python
# Linux/macOS
$ PWDEBUG=1 pytest -s
# Windows
$ set PWDEBUG=1
$ pytest -s
```
Additional useful defaults are configured when `PWDEBUG` is set:
- Browsers launch in the headed mode
- Default timeout is set to 0 (= no timeout)
- Call [`method: Page.pause`] method from your script when running in headed browser.
```js
// Pause on the following line.
await page.pause();
```
```java
// Pause on the following line.
page.pause();
```
```python async
# Pause on the following line.
await page.pause()
```
```python sync
# Pause on the following line.
page.pause()
```
- Use `open` or `codegen` commands in the Playwright [CLI](./cli.md):
```sh js
$ npx playwright codegen wikipedia.org
```
```sh java
$ mvn exec:java -e -Dexec.mainClass=com.microsoft.playwright.CLI -Dexec.args="codegen wikipedia.org"
```
```sh python
$ playwright codegen wikipedia.org
```
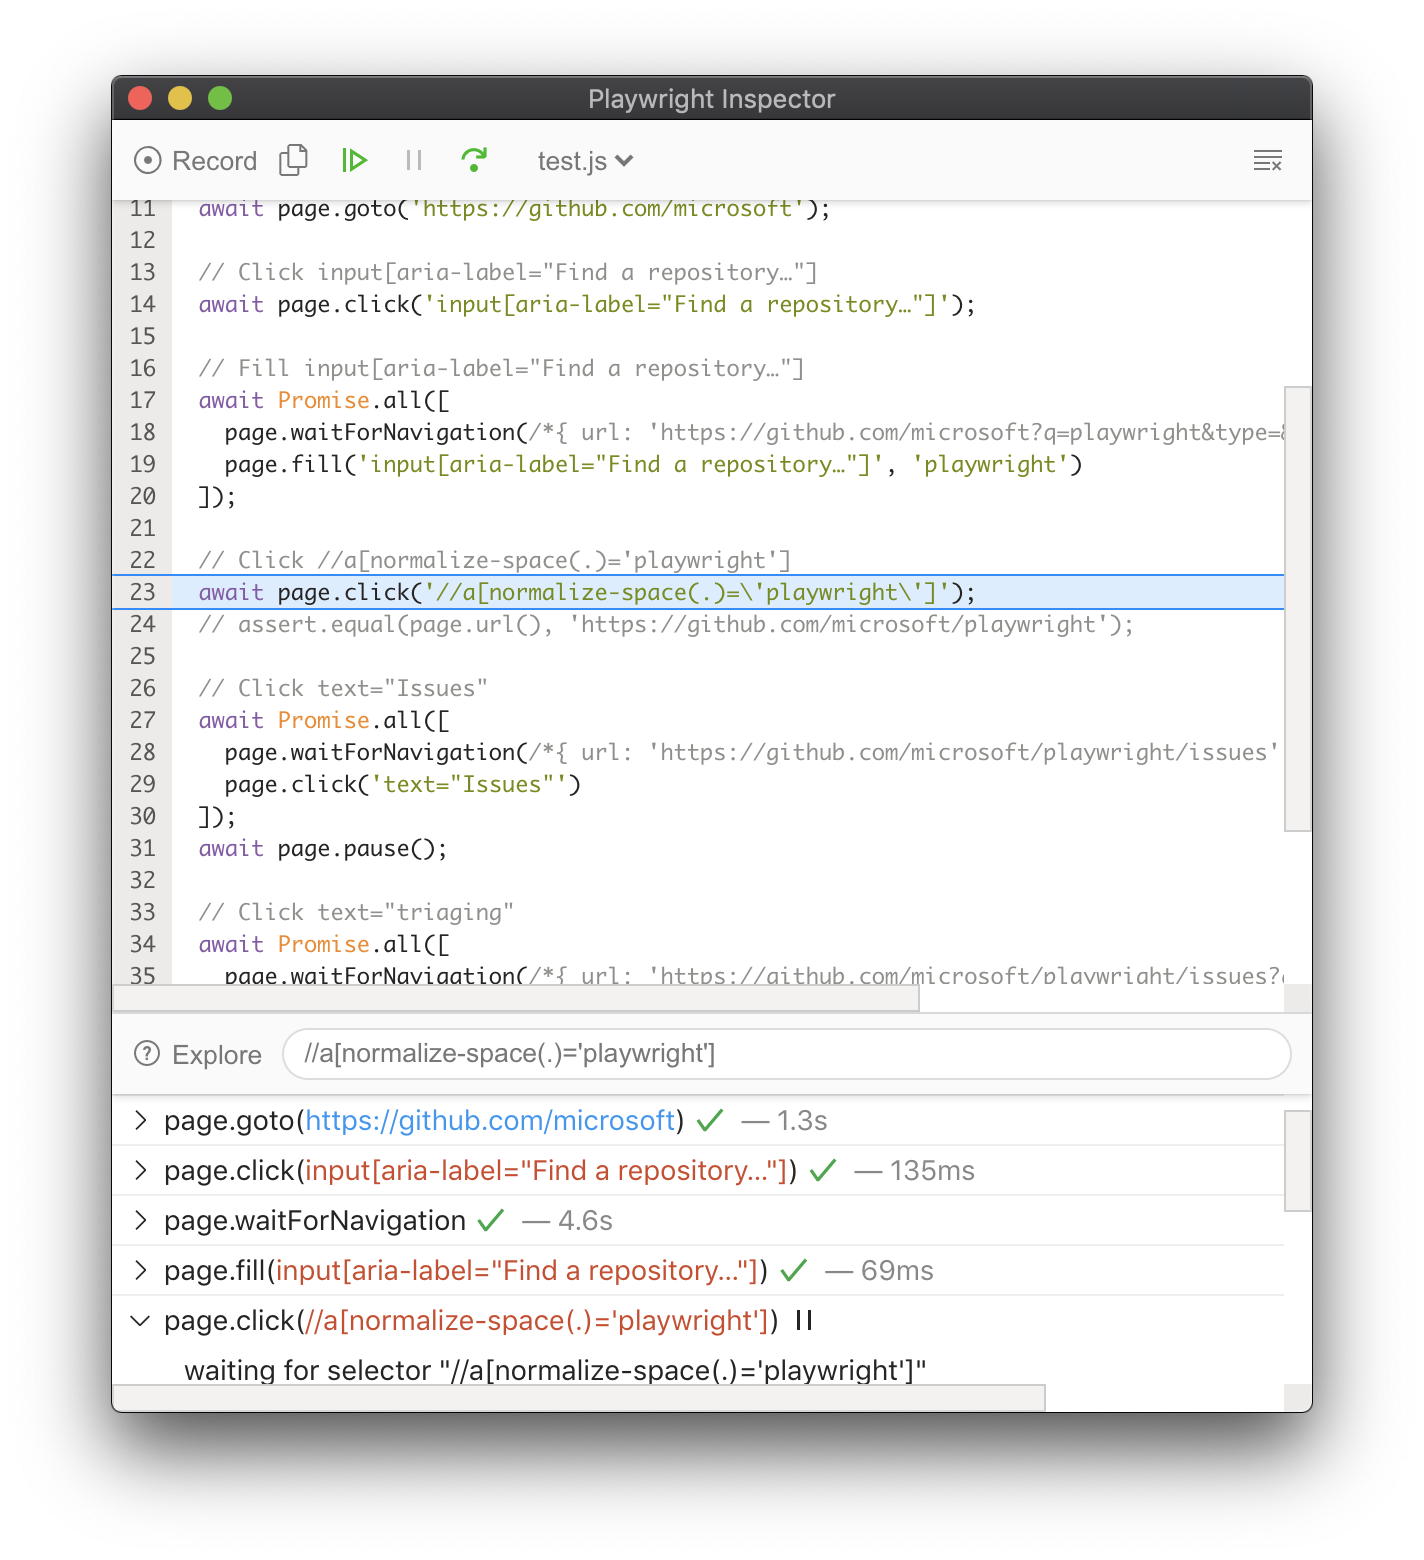
## Stepping through the Playwright script
When `PWDEBUG` is set, Playwright Inspector window will be opened and the script will be
paused on the first Playwright statement:
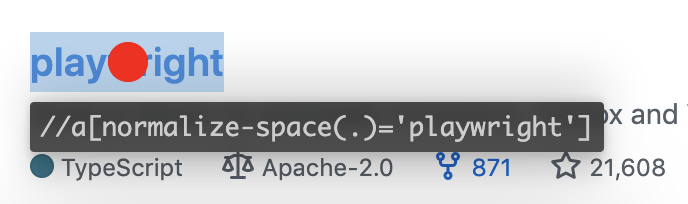
 Now we know what action is about to be performed and we can look into the details on that
action. For example, when stopped on an input action such as `click`, the exact point Playwright is about to click is highlighted with the large red dot on the inspected page:
Now we know what action is about to be performed and we can look into the details on that
action. For example, when stopped on an input action such as `click`, the exact point Playwright is about to click is highlighted with the large red dot on the inspected page:
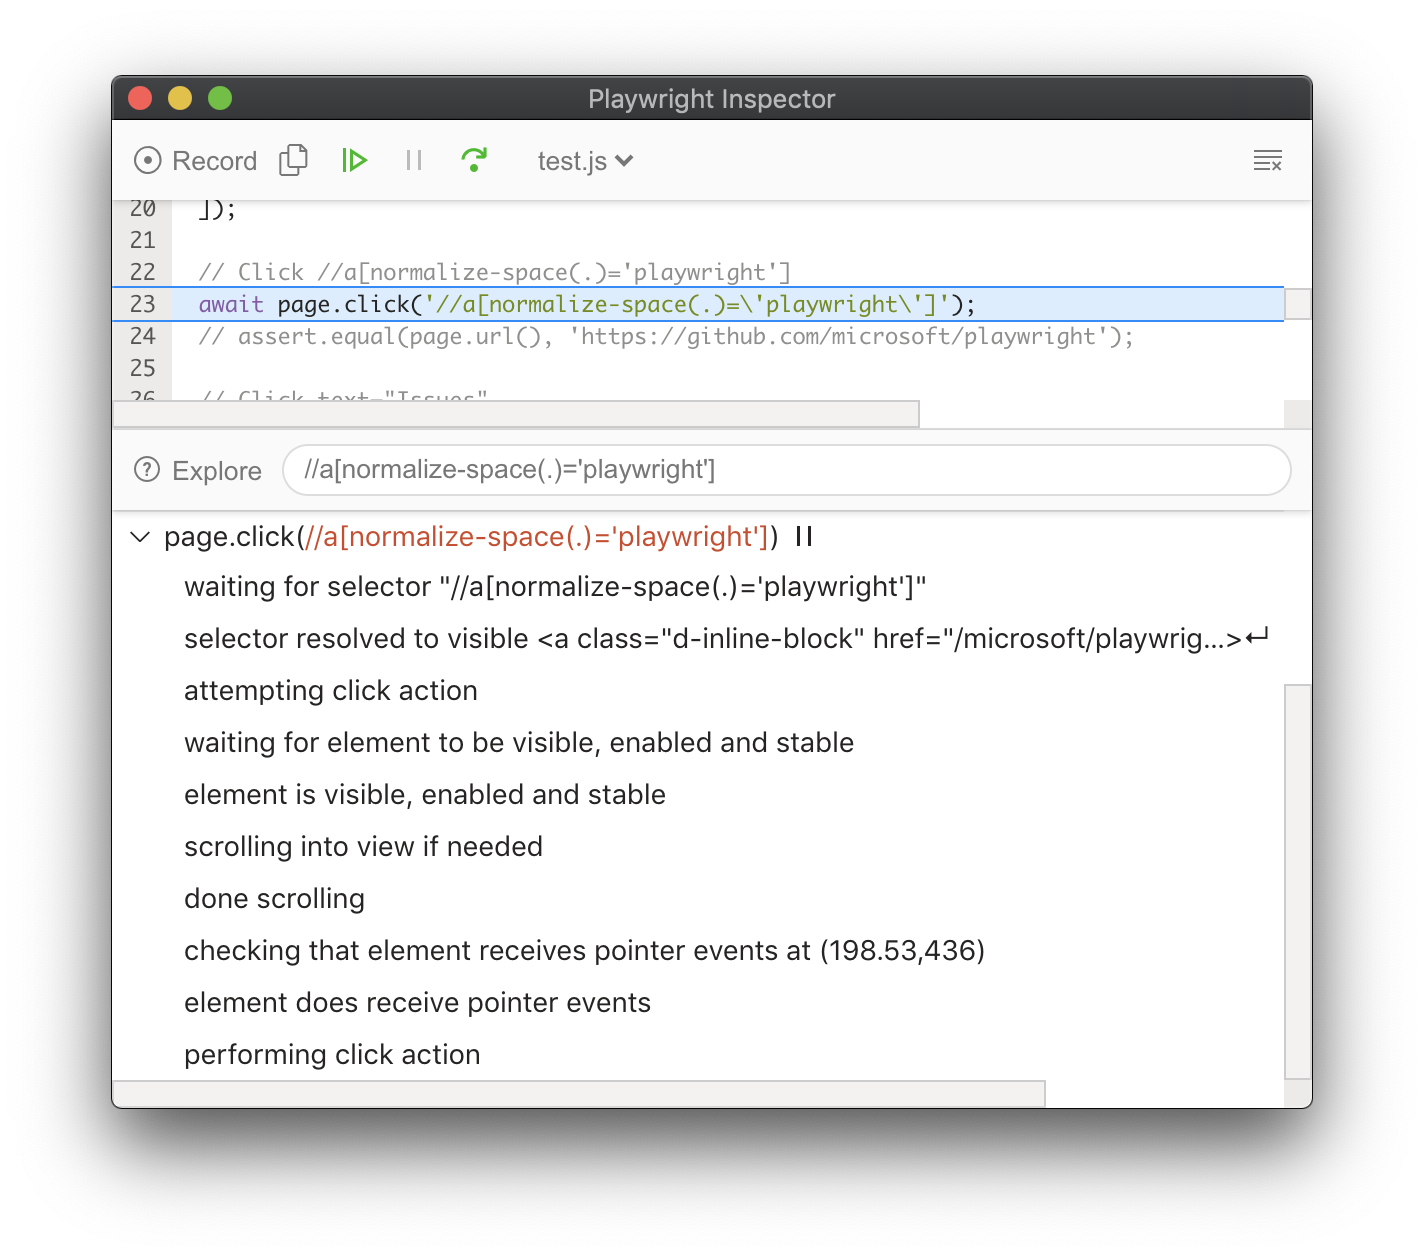
 By the time Playwright has paused on that click action, it has already performed actionability checks that can be found in the log:
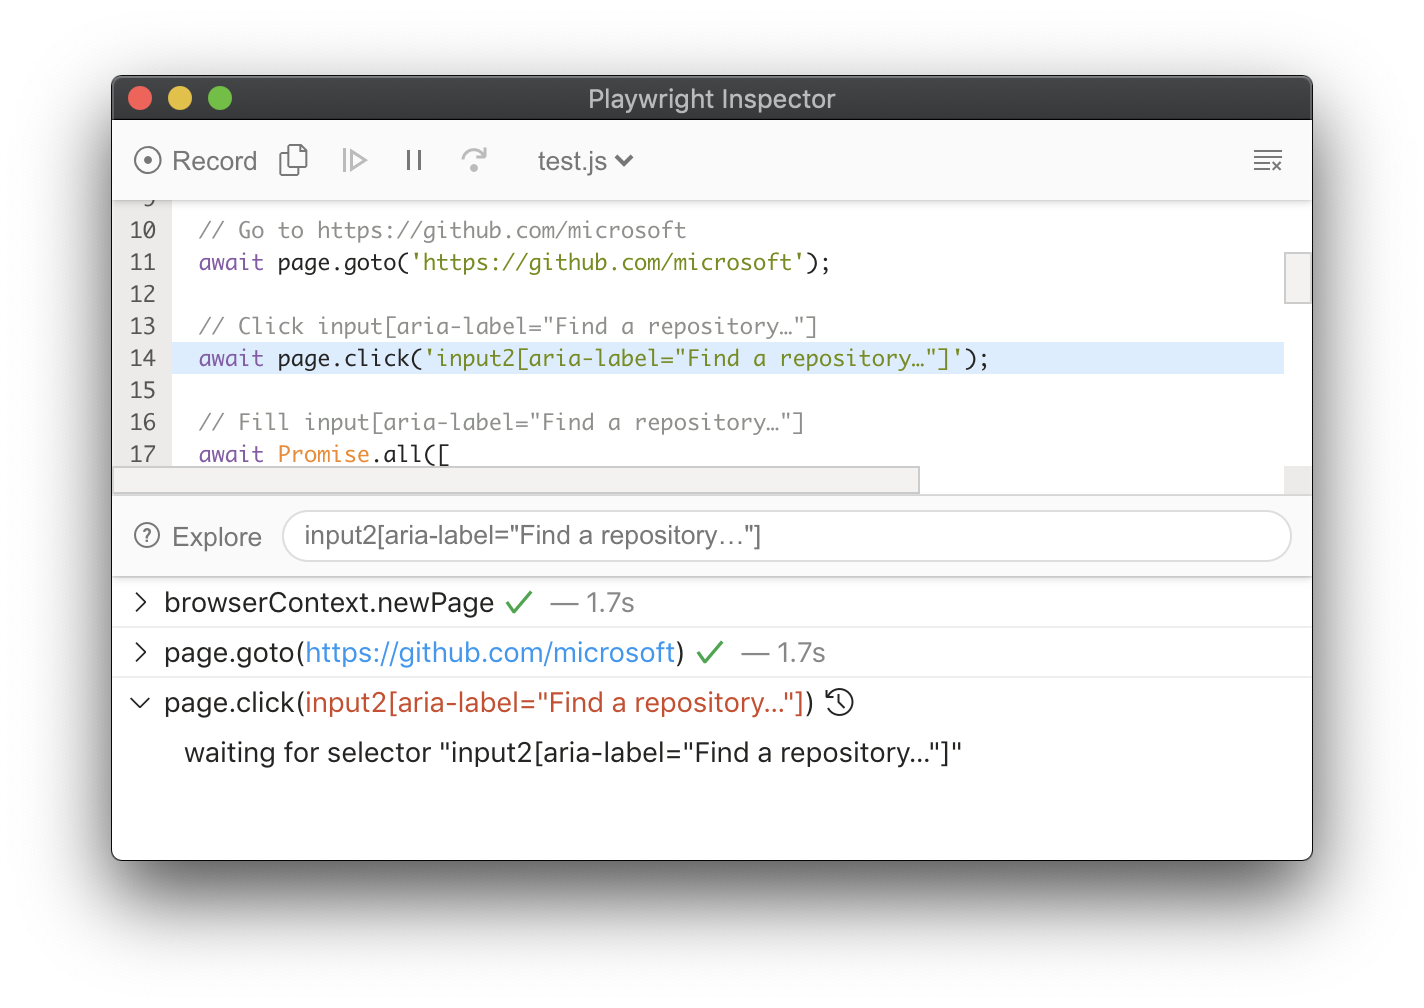
 If actionability can't be reached, it'll show action as pending:
 You can step over each action using the "Step over" action or resume script without further pauses:
 ## Debugging Selectors
- Click the Explore button to hover over elements in the screen and click them to
automatically generate selectors for those elements.
- To verify where selector points, paste it into the inspector input field:
## Debugging Selectors
- Click the Explore button to hover over elements in the screen and click them to
automatically generate selectors for those elements.
- To verify where selector points, paste it into the inspector input field:
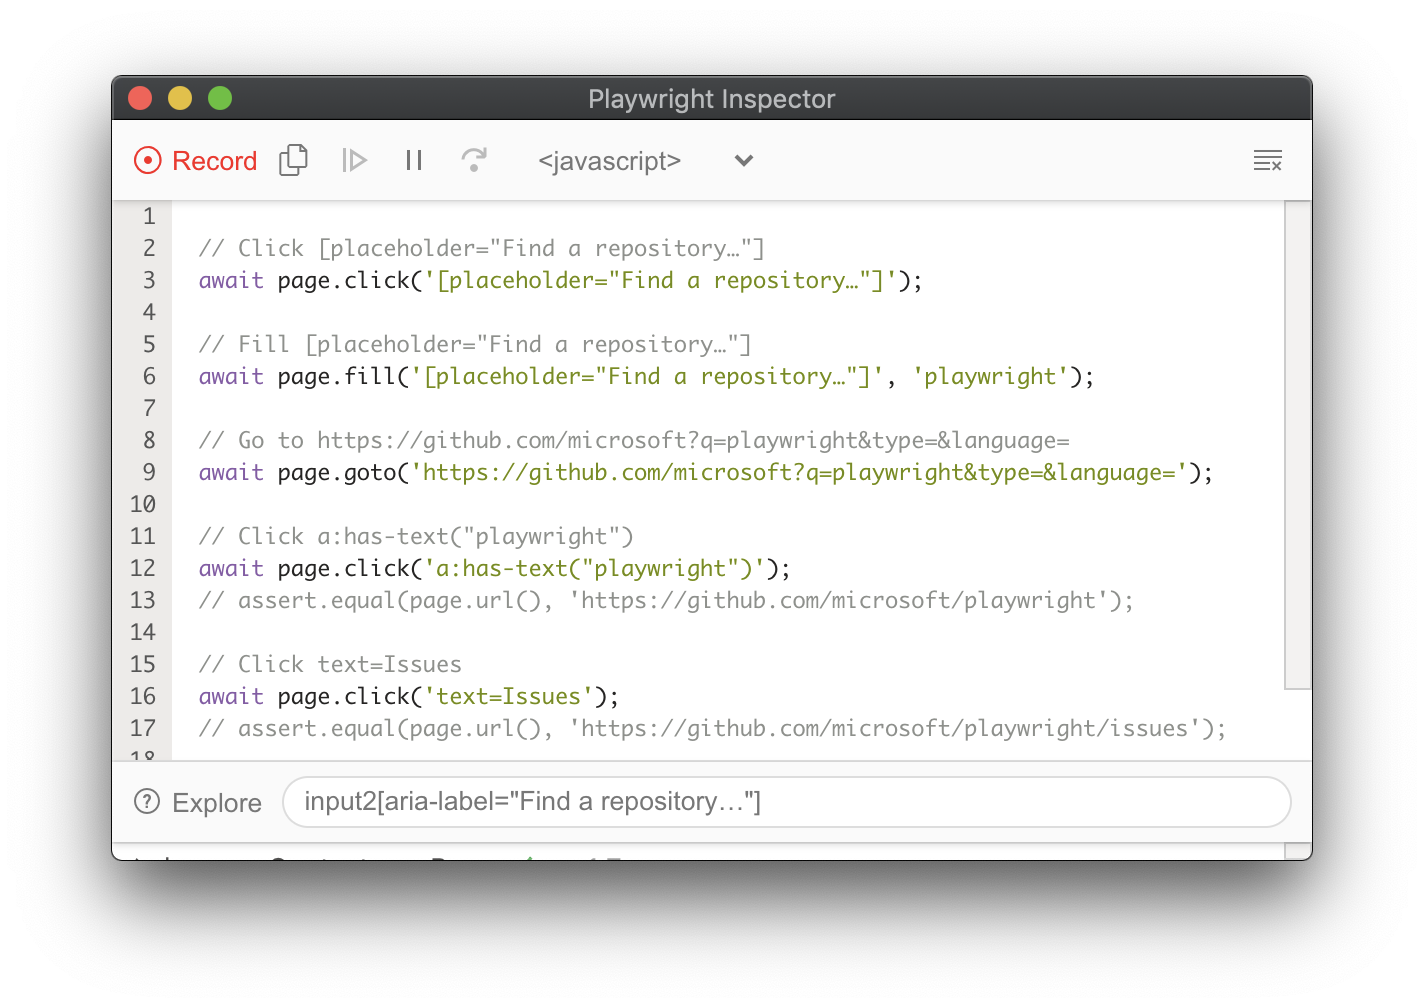
 ## Recording scripts
At any moment, clicking Record action enables recorder (codegen) mode.
Every action on the target page is turned into the generated script:
## Recording scripts
At any moment, clicking Record action enables recorder (codegen) mode.
Every action on the target page is turned into the generated script:
 You can copy entire generated script or clear it using toolbar actions.