---
id: running-tests
title: "Running Tests"
---
You can run a single test, a set of tests or all tests. Tests can be run on one browser or multiple browsers. By default tests are run in a headless manner meaning no browser window will be opened while running the tests and results will be seen in the terminal.
**You will learn**
- [How to run tests from the command line](/running-tests.md#command-line)
- [How to debug tests](/running-tests.md#debugging-tests)
- [How to open the HTML test reporter](/running-tests.md#test-reports)
:::note
For a better debugging experience check out the [VS Code Extension](./getting-started-vscode.md) for Playwright where you can run tests, add breakpoints and debug your tests right from the VS Code editor.
:::
## Command Line
- Running all tests
```bash
npx playwright test
```
- Running a single test file
```bash
npx playwright test landing-page.spec.ts
```
- Run a set of test files
```bash
npx playwright test tests/todo-page/ tests/landing-page/
```
- Run files that have `landing` or `login` in the file name
```bash
npx playwright test landing login
```
- Run the test with the title
```bash
npx playwright test -g "add a todo item"
```
- Running tests in headed mode
```bash
npx playwright test landing-page.spec.ts --headed
```
- Running tests on a specific project
```bash
npx playwright test landing-page.ts --project=chromium
```
## Debugging Tests
Since Playwright runs in Node.js, you can debug it with your debugger of choice e.g. using `console.log` or inside your IDE or directly in VS Code with the [VS Code Extension](./getting-started-vscode.md). Playwright comes with the [Playwright Inspector](./debug.md#playwright-inspector) which allows you to step through Playwright API calls, see their debug logs and explore [locators](./locators.md).
- Debugging all tests:
```bash
npx playwright test --debug
```
- Debugging one test file:
```bash
npx playwright test example.spec.ts --debug
```
- Debugging a test from the line number where the `test(..` is defined:
```bash
npx playwright test example.spec.ts:10 --debug
```
 Check out our [debugging guide](./debug.md) to learn more about the [Playwright Inspector](./debug.md#playwright-inspector) as well as debugging with [Browser Developer tools](./debug.md#browser-developer-tools).
## Test Reports
The [HTML Reporter](./test-reporters.md#html-reporter) is a built in reporter which shows you a full report of all your tests that have been ran. It shows the name of the test as well as the file name with the line number of the test next to it as well as how long each test took to run and what browsers they were ran on. You can filter the report by passed tests, failed tests, skipped tests or flaky tests. You can also filter by browsers by clicking on the name of the browser next to a test. You can also search for a particular test or browser using the search bar.
To open the report first run your tests:
```bash
npx playwright test
```
By default, the HTML report is opened automatically if some of the tests failed. If you need to open the report manually you can use the following command:
```bash
npx playwright show-report
```
Check out our [debugging guide](./debug.md) to learn more about the [Playwright Inspector](./debug.md#playwright-inspector) as well as debugging with [Browser Developer tools](./debug.md#browser-developer-tools).
## Test Reports
The [HTML Reporter](./test-reporters.md#html-reporter) is a built in reporter which shows you a full report of all your tests that have been ran. It shows the name of the test as well as the file name with the line number of the test next to it as well as how long each test took to run and what browsers they were ran on. You can filter the report by passed tests, failed tests, skipped tests or flaky tests. You can also filter by browsers by clicking on the name of the browser next to a test. You can also search for a particular test or browser using the search bar.
To open the report first run your tests:
```bash
npx playwright test
```
By default, the HTML report is opened automatically if some of the tests failed. If you need to open the report manually you can use the following command:
```bash
npx playwright show-report
```
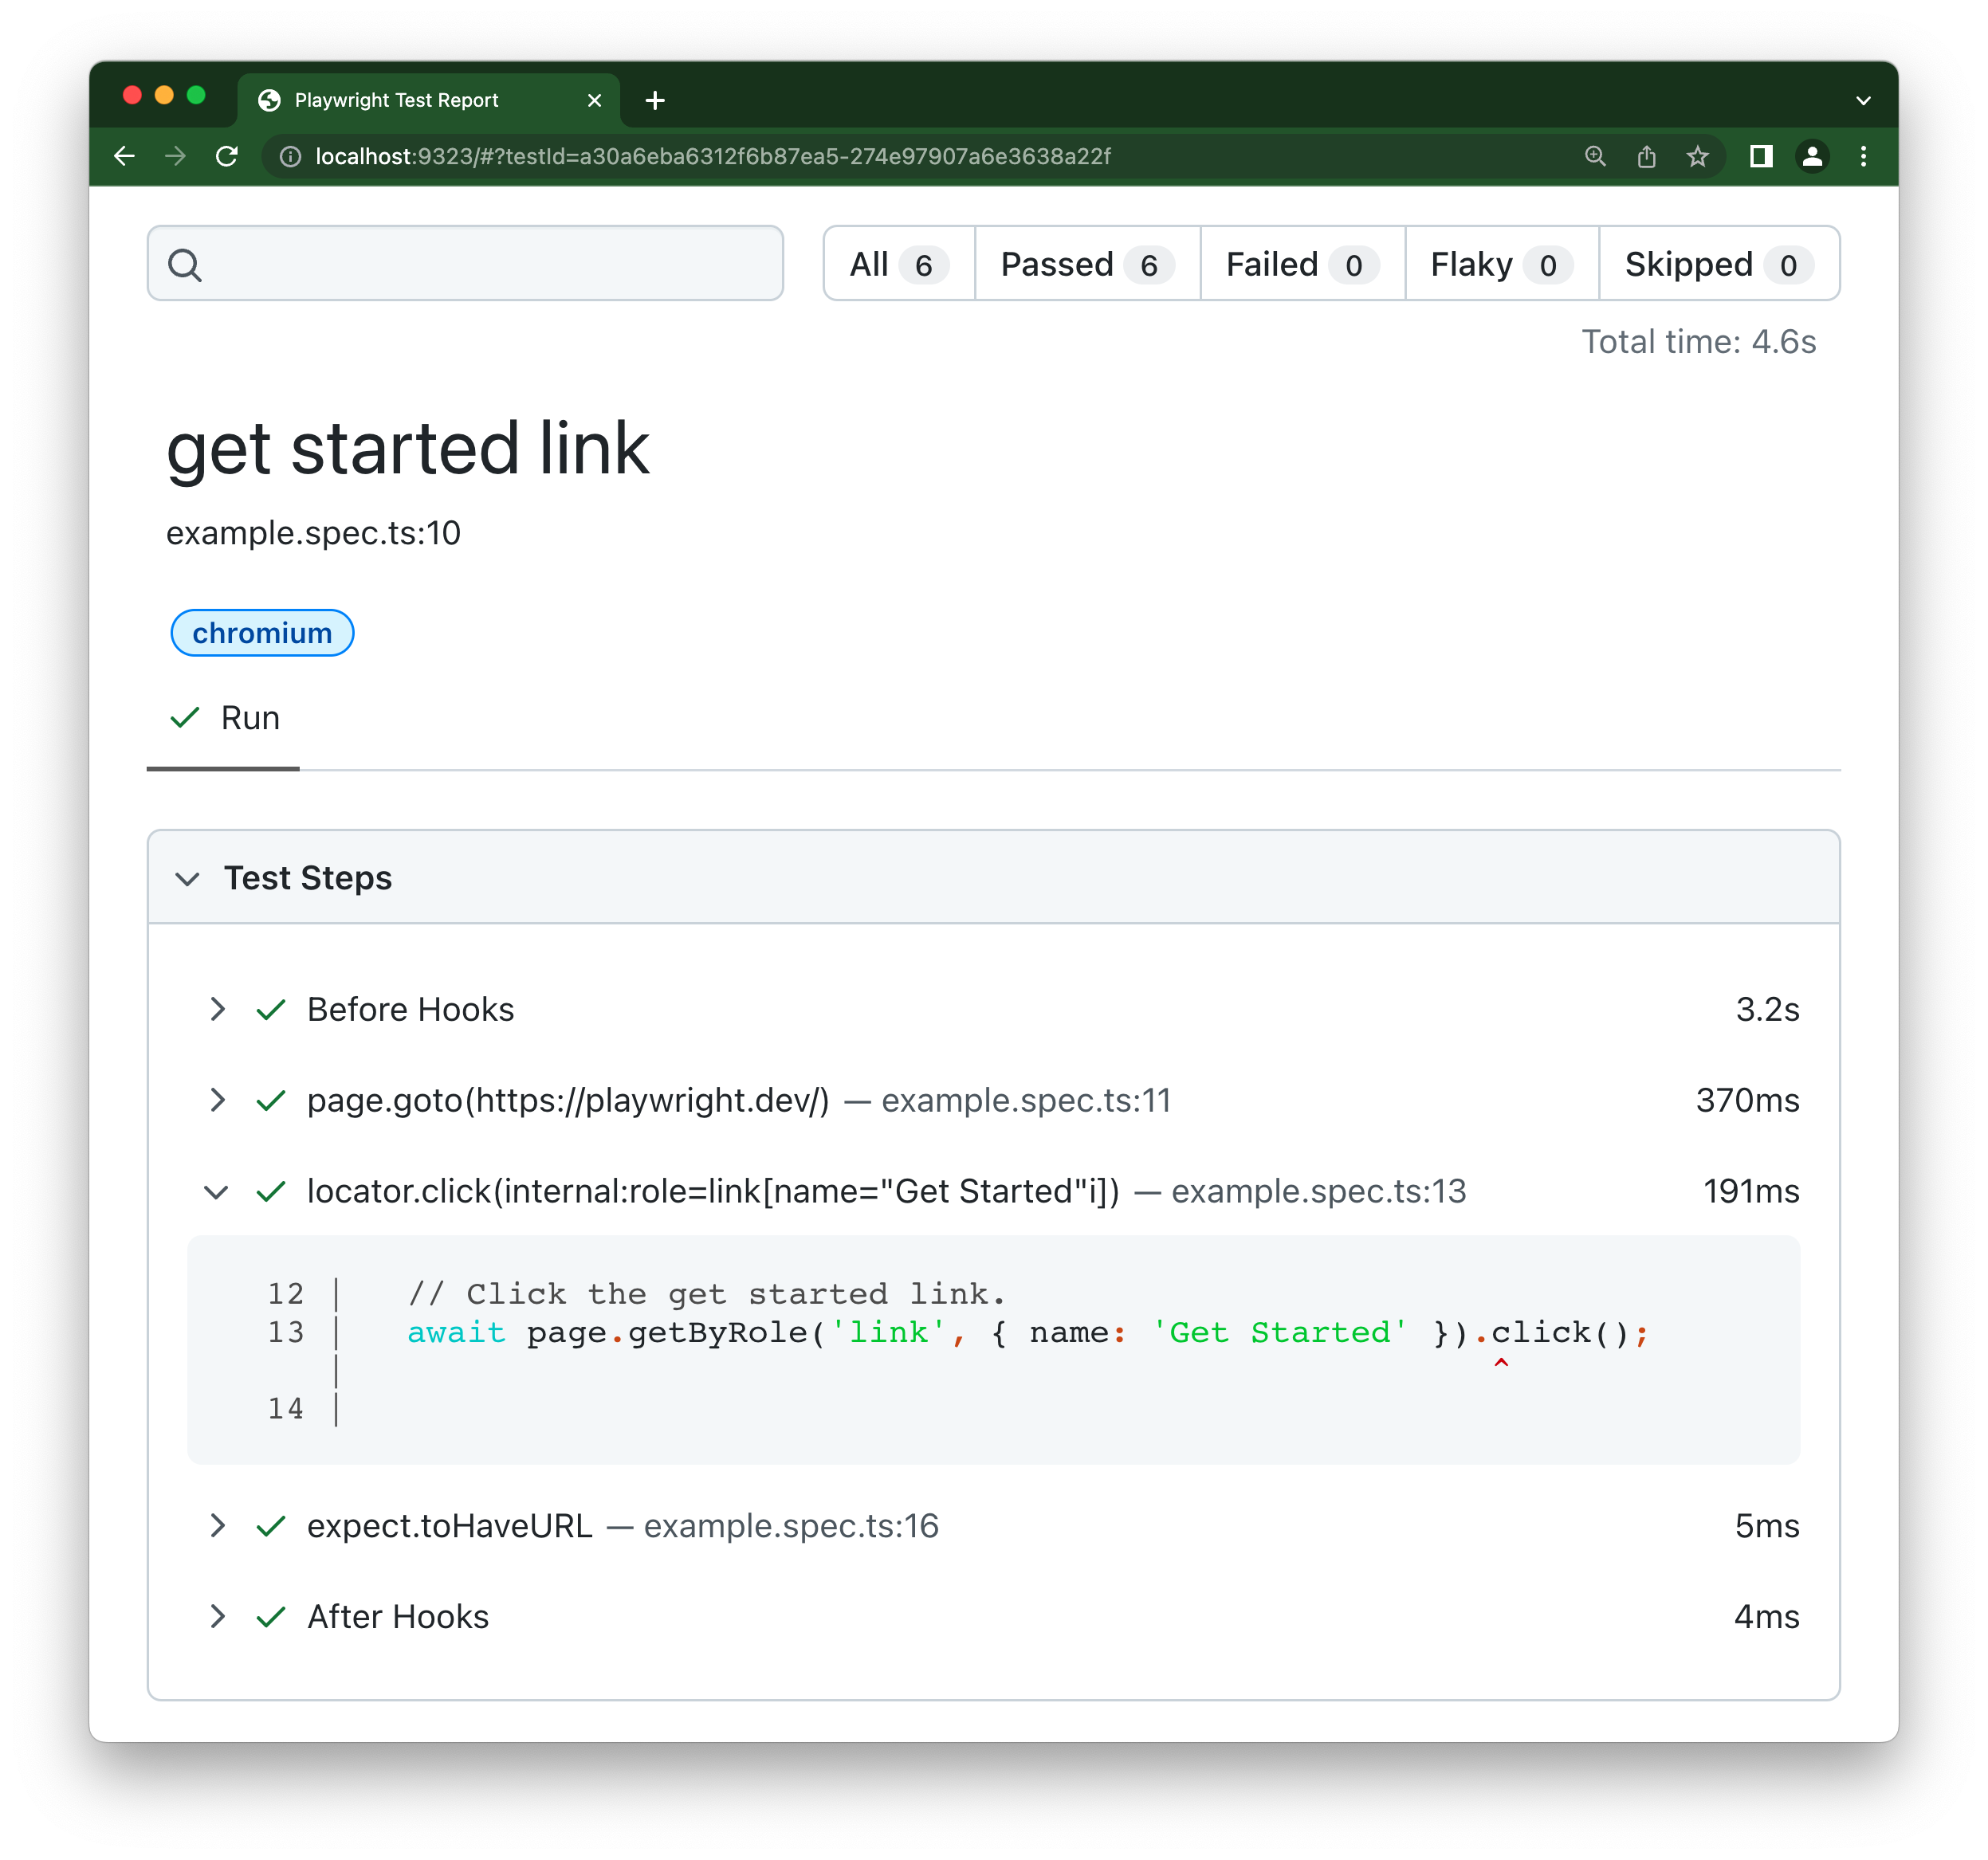
 You can open a detailed view of each test by clicking on the test name. You can then explore the tests errors as well as expand each step of the test to see the code for that step and how long each step took to run.
 For projects created with `create-playwright` the HTML report is enabled by default. If you have a config which does not use the HTML report or running the show-report command yields to no reports, you can run it with `--reporter=html`.
```bash
npx playwright show-report --reporter=html
```
## What's Next
- [Generate tests with Codegen](./codegen-intro.md)
- [See a trace of your tests](./trace-viewer-intro.md)
For projects created with `create-playwright` the HTML report is enabled by default. If you have a config which does not use the HTML report or running the show-report command yields to no reports, you can run it with `--reporter=html`.
```bash
npx playwright show-report --reporter=html
```
## What's Next
- [Generate tests with Codegen](./codegen-intro.md)
- [See a trace of your tests](./trace-viewer-intro.md)