---
id: debug
title: "Debugging tools"
---
Playwright scripts work with existing debugging tools, like Node.js debuggers
and browser developer tools. Playwright also introduces new debugging features
for browser automation.
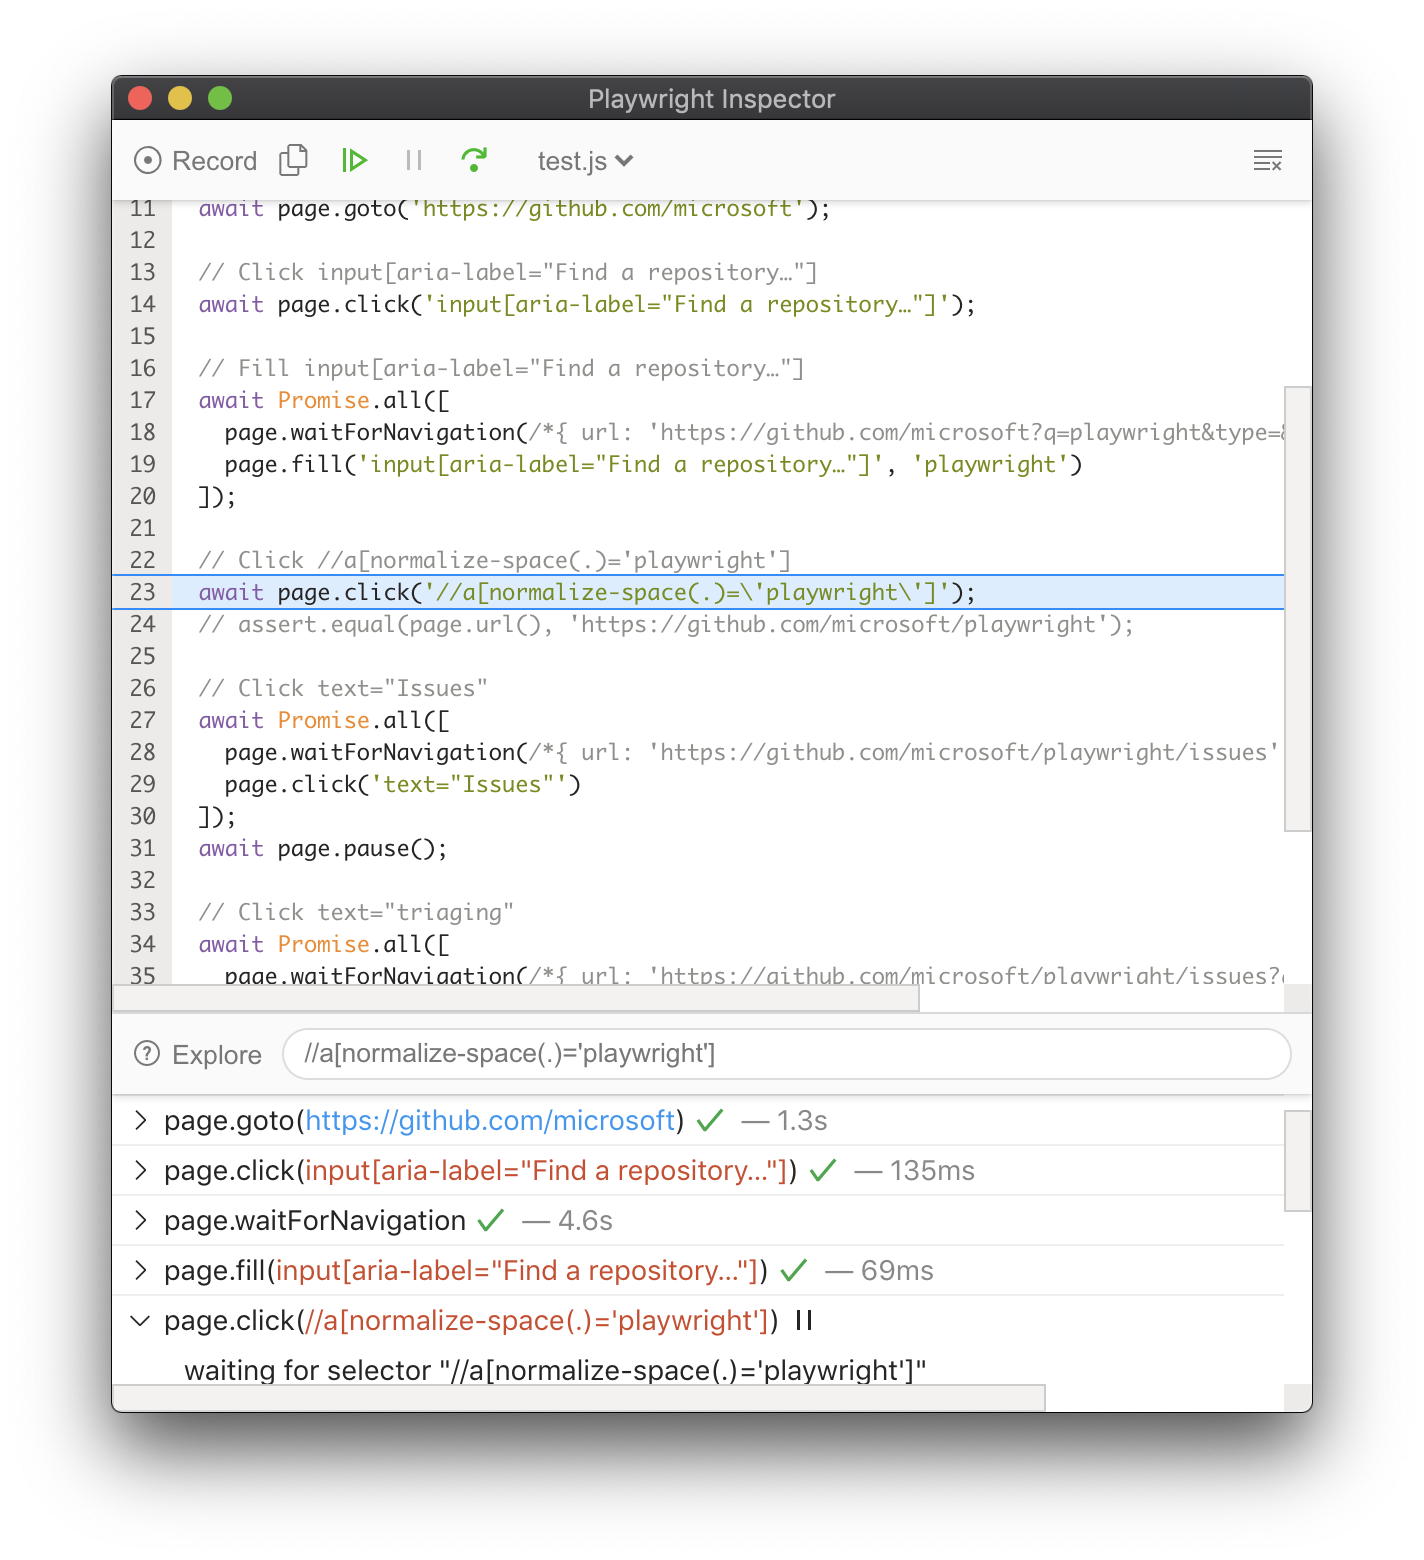
## Playwright Inspector
[Playwright Inspector](./inspector.md) is a GUI tool that helps authoring and debugging Playwright scripts. That's our default recommended tool for scripts troubleshooting.
 ## Run in headful mode
Playwright runs browsers in headless mode by default. To change this behavior,
use `headless: false` as a launch option. You can also use the [`option: slowMo`] option
to slow down execution and follow along while debugging.
```js
await chromium.launch({ headless: false, slowMo: 100 }); // or firefox, webkit
```
```java
chromium.launch(new BrowserType.LaunchOptions() // or firefox, webkit
.setHeadless(false)
.setSlowMo(100));
```
```python async
await chromium.launch(headless=False, slow_mo=100) # or firefox, webkit
```
```python sync
chromium.launch(headless=False, slow_mo=100) # or firefox, webkit
```
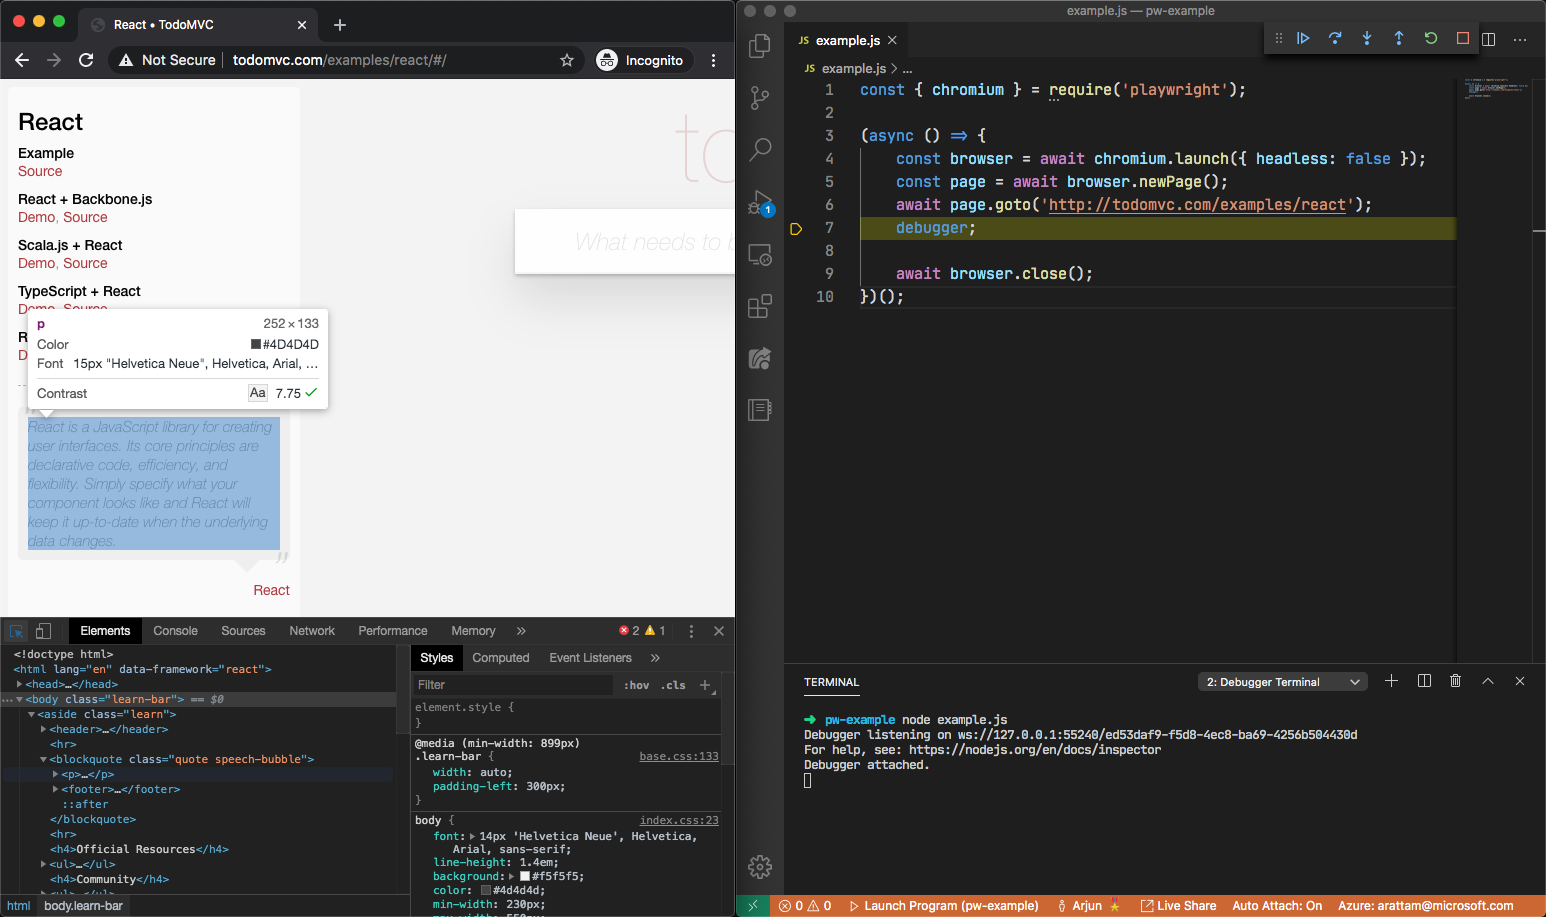
## Visual Studio Code debugger (Node.JS)
The VS Code debugger can be used to pause and resume execution of Playwright
scripts with breakpoints. The debugger can be configured in two ways.
### Use launch config
Setup [`launch.json` configuration](https://code.visualstudio.com/docs/nodejs/nodejs-debugging)
for your Node.js project. Once configured launch the scripts with F5 and use
breakpoints.
### Use the new JavaScript debugging terminal
1. Set a breakpoint in VS Code
* Use the `debugger` keyword or set a breakpoint in the VS Code UI
1. Run your Node.js script from the terminal
## Browser Developer Tools
You can use browser developer tools in Chromium, Firefox and WebKit while running
a Playwright script. Developer tools help to:
* Inspect the DOM tree and **find element selectors**
* **See console logs** during execution (or learn how to [read logs via API](./verification.md#console-logs))
* Check **network activity** and other developer tools features
## Run in headful mode
Playwright runs browsers in headless mode by default. To change this behavior,
use `headless: false` as a launch option. You can also use the [`option: slowMo`] option
to slow down execution and follow along while debugging.
```js
await chromium.launch({ headless: false, slowMo: 100 }); // or firefox, webkit
```
```java
chromium.launch(new BrowserType.LaunchOptions() // or firefox, webkit
.setHeadless(false)
.setSlowMo(100));
```
```python async
await chromium.launch(headless=False, slow_mo=100) # or firefox, webkit
```
```python sync
chromium.launch(headless=False, slow_mo=100) # or firefox, webkit
```
## Visual Studio Code debugger (Node.JS)
The VS Code debugger can be used to pause and resume execution of Playwright
scripts with breakpoints. The debugger can be configured in two ways.
### Use launch config
Setup [`launch.json` configuration](https://code.visualstudio.com/docs/nodejs/nodejs-debugging)
for your Node.js project. Once configured launch the scripts with F5 and use
breakpoints.
### Use the new JavaScript debugging terminal
1. Set a breakpoint in VS Code
* Use the `debugger` keyword or set a breakpoint in the VS Code UI
1. Run your Node.js script from the terminal
## Browser Developer Tools
You can use browser developer tools in Chromium, Firefox and WebKit while running
a Playwright script. Developer tools help to:
* Inspect the DOM tree and **find element selectors**
* **See console logs** during execution (or learn how to [read logs via API](./verification.md#console-logs))
* Check **network activity** and other developer tools features
 > **For WebKit**: Note that launching WebKit Inspector during the execution will
prevent the Playwright script from executing any further.
### API for Chromium
In Chromium, you can also open developer tools through a launch option.
```js
await chromium.launch({ devtools: true });
```
```java
chromium.launch(new BrowserType.LaunchOptions().setDevtools(true));
```
```python async
await chromium.launch(devtools=True)
```
```python sync
chromium.launch(devtools=True)
```
## Run in Debug Mode
Set the `PWDEBUG` environment variable to run your scripts in debug mode. This
configures the browser for debugging.
```sh js
# Linux/macOS
$ PWDEBUG=1 npm run test
# Windows
$ set PWDEBUG=1
$ npm run test
```
```sh java
# Linux/macOS
$ PWDEBUG=1 mvn test
# Windows
$ set PWDEBUG=1
$ mvn test
```
```sh python
# Linux/macOS
$ PWDEBUG=1 pytest -s
# Windows
$ set PWDEBUG=1
$ pytest -s
```
### Defaults
With PWDEBUG, the following defaults are configured for you:
* **Run in headful**: With PWDEBUG, browsers always launch in headful mode
* **Disables timeout**: PWDEBUG sets timeout to 0 (= no timeout)
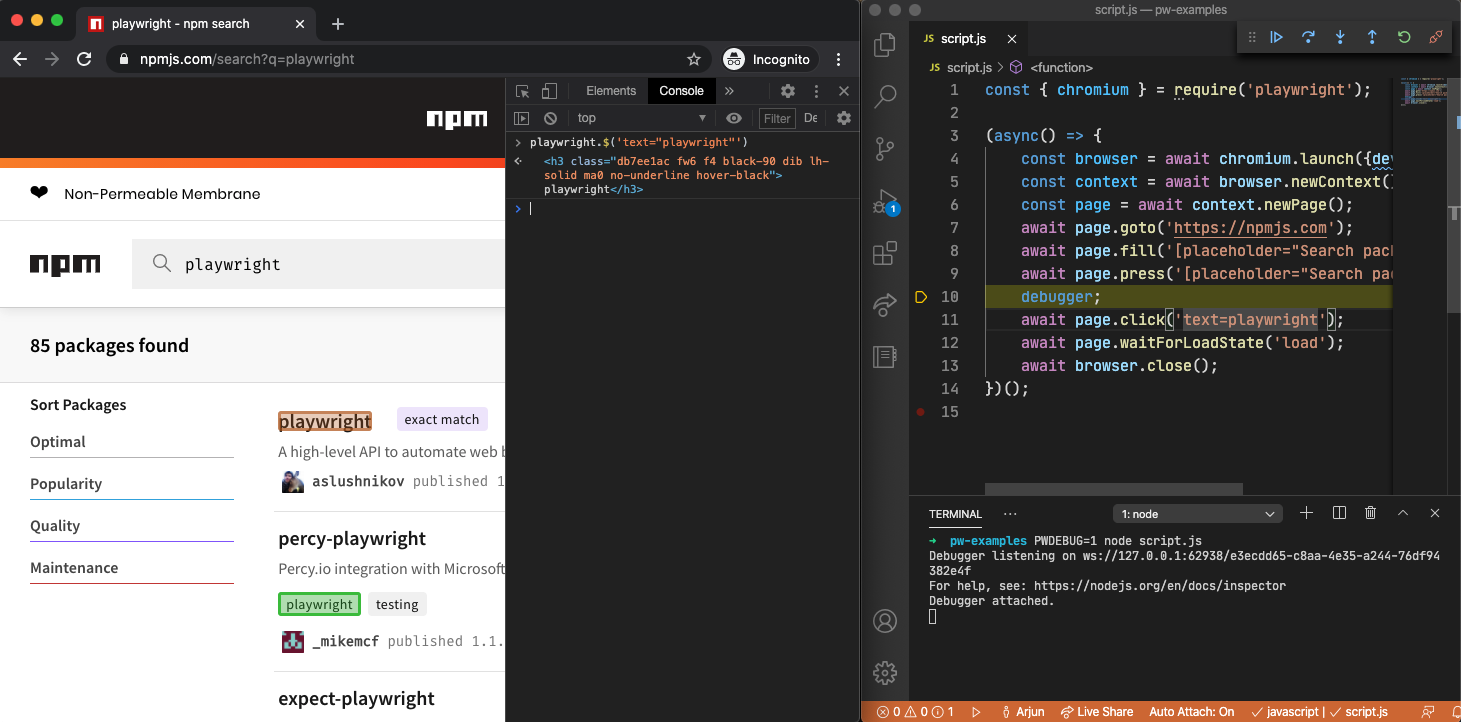
### Debugging Selectors
PWDEBUG configures a `playwright` object in the browser to highlight
[Playwright selectors](./selectors.md). This can be used to verify text or
composite selectors. To use this:
1. Setup a breakpoint to pause the execution
1. Open the console panel in browser developer tools
1. Use the `playwright` API
* `playwright.$(selector)`: Highlight the first occurrence of the selector. This reflects
how `page.$` would see the page.
* `playwright.$$(selector)`: Highlight all occurrences of the selector. This reflects
how `page.$$` would see the page.
* `playwright.inspect(selector)`: Inspect the selector in the Elements panel.
* `playwright.clear()`: Clear existing highlights.
> **For WebKit**: Note that launching WebKit Inspector during the execution will
prevent the Playwright script from executing any further.
### API for Chromium
In Chromium, you can also open developer tools through a launch option.
```js
await chromium.launch({ devtools: true });
```
```java
chromium.launch(new BrowserType.LaunchOptions().setDevtools(true));
```
```python async
await chromium.launch(devtools=True)
```
```python sync
chromium.launch(devtools=True)
```
## Run in Debug Mode
Set the `PWDEBUG` environment variable to run your scripts in debug mode. This
configures the browser for debugging.
```sh js
# Linux/macOS
$ PWDEBUG=1 npm run test
# Windows
$ set PWDEBUG=1
$ npm run test
```
```sh java
# Linux/macOS
$ PWDEBUG=1 mvn test
# Windows
$ set PWDEBUG=1
$ mvn test
```
```sh python
# Linux/macOS
$ PWDEBUG=1 pytest -s
# Windows
$ set PWDEBUG=1
$ pytest -s
```
### Defaults
With PWDEBUG, the following defaults are configured for you:
* **Run in headful**: With PWDEBUG, browsers always launch in headful mode
* **Disables timeout**: PWDEBUG sets timeout to 0 (= no timeout)
### Debugging Selectors
PWDEBUG configures a `playwright` object in the browser to highlight
[Playwright selectors](./selectors.md). This can be used to verify text or
composite selectors. To use this:
1. Setup a breakpoint to pause the execution
1. Open the console panel in browser developer tools
1. Use the `playwright` API
* `playwright.$(selector)`: Highlight the first occurrence of the selector. This reflects
how `page.$` would see the page.
* `playwright.$$(selector)`: Highlight all occurrences of the selector. This reflects
how `page.$$` would see the page.
* `playwright.inspect(selector)`: Inspect the selector in the Elements panel.
* `playwright.clear()`: Clear existing highlights.
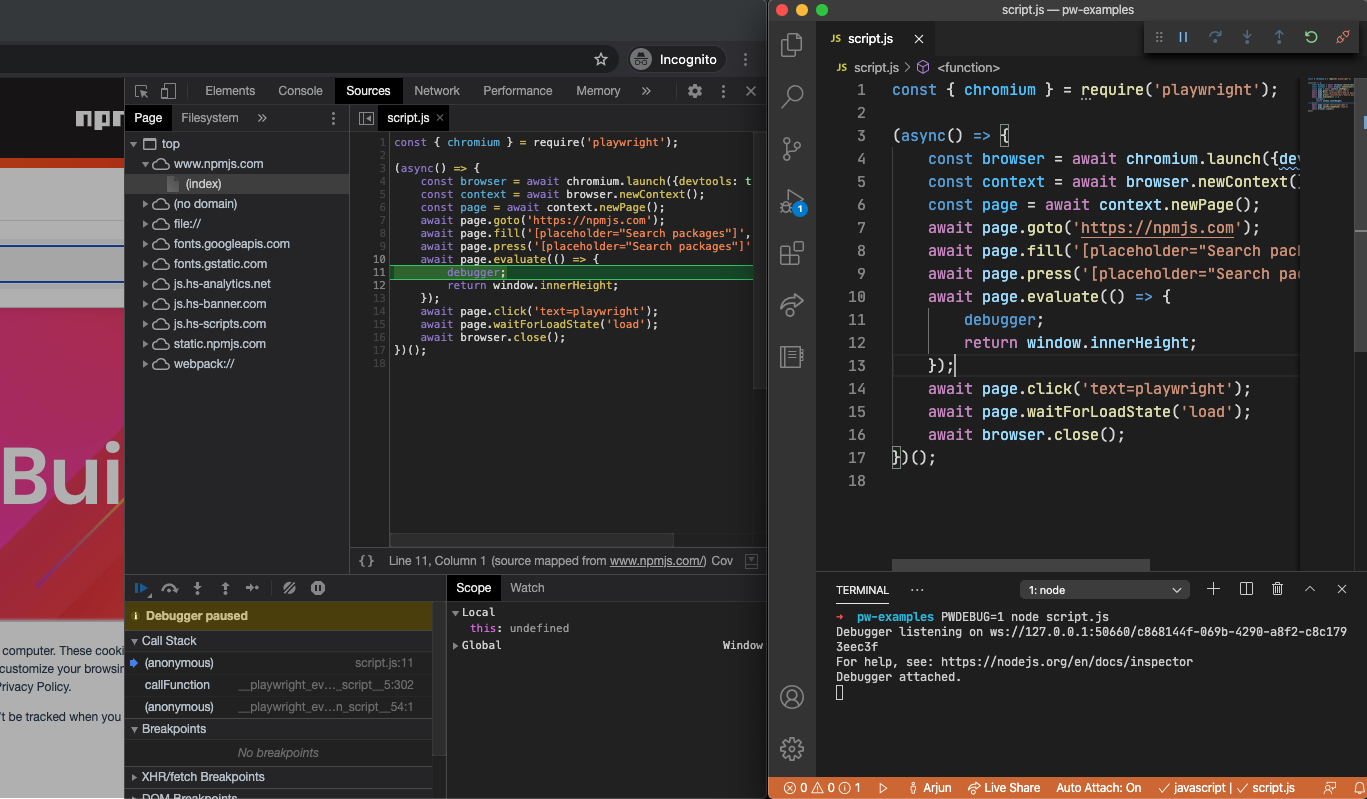
 ### Evaluate Source Maps
PWDEBUG also enables source maps for [`method: Page.evaluate`] [executions](./core-concepts.md#evaluation).
This improves the debugging experience for JavaScript executions in the page context.
### Evaluate Source Maps
PWDEBUG also enables source maps for [`method: Page.evaluate`] [executions](./core-concepts.md#evaluation).
This improves the debugging experience for JavaScript executions in the page context.
 ## Verbose API logs
Playwright supports verbose logging with the `DEBUG` environment variable.
```sh js
# Linux/macOS
$ DEBUG=pw:api npm run test
# Windows
$ set DEBUG=pw:api
$ npm run test
```
```sh java
# Linux/macOS
$ DEBUG=pw:api mvn test
# Windows
$ set DEBUG=pw:api
$ mvn test
```
```sh python
# Linux/macOS
$ DEBUG=pw:api pytest -s
# Windows
$ set DEBUG=pw:api
$ pytest -s
```
## Verbose API logs
Playwright supports verbose logging with the `DEBUG` environment variable.
```sh js
# Linux/macOS
$ DEBUG=pw:api npm run test
# Windows
$ set DEBUG=pw:api
$ npm run test
```
```sh java
# Linux/macOS
$ DEBUG=pw:api mvn test
# Windows
$ set DEBUG=pw:api
$ mvn test
```
```sh python
# Linux/macOS
$ DEBUG=pw:api pytest -s
# Windows
$ set DEBUG=pw:api
$ pytest -s
```