4.6 KiB
| id | title |
|---|---|
| trace-viewer | Trace Viewer |
Playwright Trace Viewer is a GUI tool that helps exploring recorded Playwright traces after the script ran.
Recording a trace
Traces can be recorded using the [property: BrowserContext.tracing] API as follows:
const browser = await chromium.launch();
const context = await browser.newContext();

// Start tracing before creating / navigating a page.
await context.tracing.start({ screenshots: true, snapshots: true });

const page = await context.newPage();
await page.goto('https://playwright.dev');

// Stop tracing and export it into a zip archive.
await context.tracing.stop({ path: 'trace.zip' });
Browser browser = chromium.launch();
BrowserContext context = browser.newContext();

// Start tracing before creating / navigating a page.
context.tracing.start(new Tracing.StartOptions()
  .setScreenshots(true)
  .setSnapshots(true);

Page page = context.newPage();
page.goto("https://playwright.dev");

// Stop tracing and export it into a zip archive.
context.tracing.stop(new Tracing.StopOptions()
  .setPath(Paths.get("trace.zip")));
browser = await chromium.launch()
context = await browser.new_context()

# Start tracing before creating / navigating a page.
await context.tracing.start(screenshots=True, snapshots=True)

await page.goto("https://playwright.dev")

# Stop tracing and export it into a zip archive.
await context.tracing.stop(path = "trace.zip")
browser = chromium.launch()
context = browser.new_context()

# Start tracing before creating / navigating a page.
context.tracing.start(screenshots=True, snapshots=True)

page.goto("https://playwright.dev")

# Stop tracing and export it into a zip archive.
context.tracing.stop(path = "trace.zip")
await using var browser = playwright.Chromium.LaunchAsync();
await using var context = await browser.NewContextAsync();

// Start tracing before creating / navigating a page.
await context.Tracing.StartAsync(new TracingStartOptions
{
  Screenshots: true,
  Snapshots: true
});

var page = context.NewPageAsync();
await page.GotoAsync("https://playwright.dev");

// Stop tracing and export it into a zip archive.
await context.Tracing.StopAsync(new TracingStopOptions
{
  Path: "trace.zip"
});
This will record the trace and place it into the file named trace.zip.
Viewing the trace
You can open the saved trace using Playwright CLI:
npx playwright show-trace trace.zip
mvn exec:java -e -Dexec.mainClass=com.microsoft.playwright.CLI -Dexec.args="show-trace trace.zip"
playwright show-trace trace.zip
playwright show-trace trace.zip
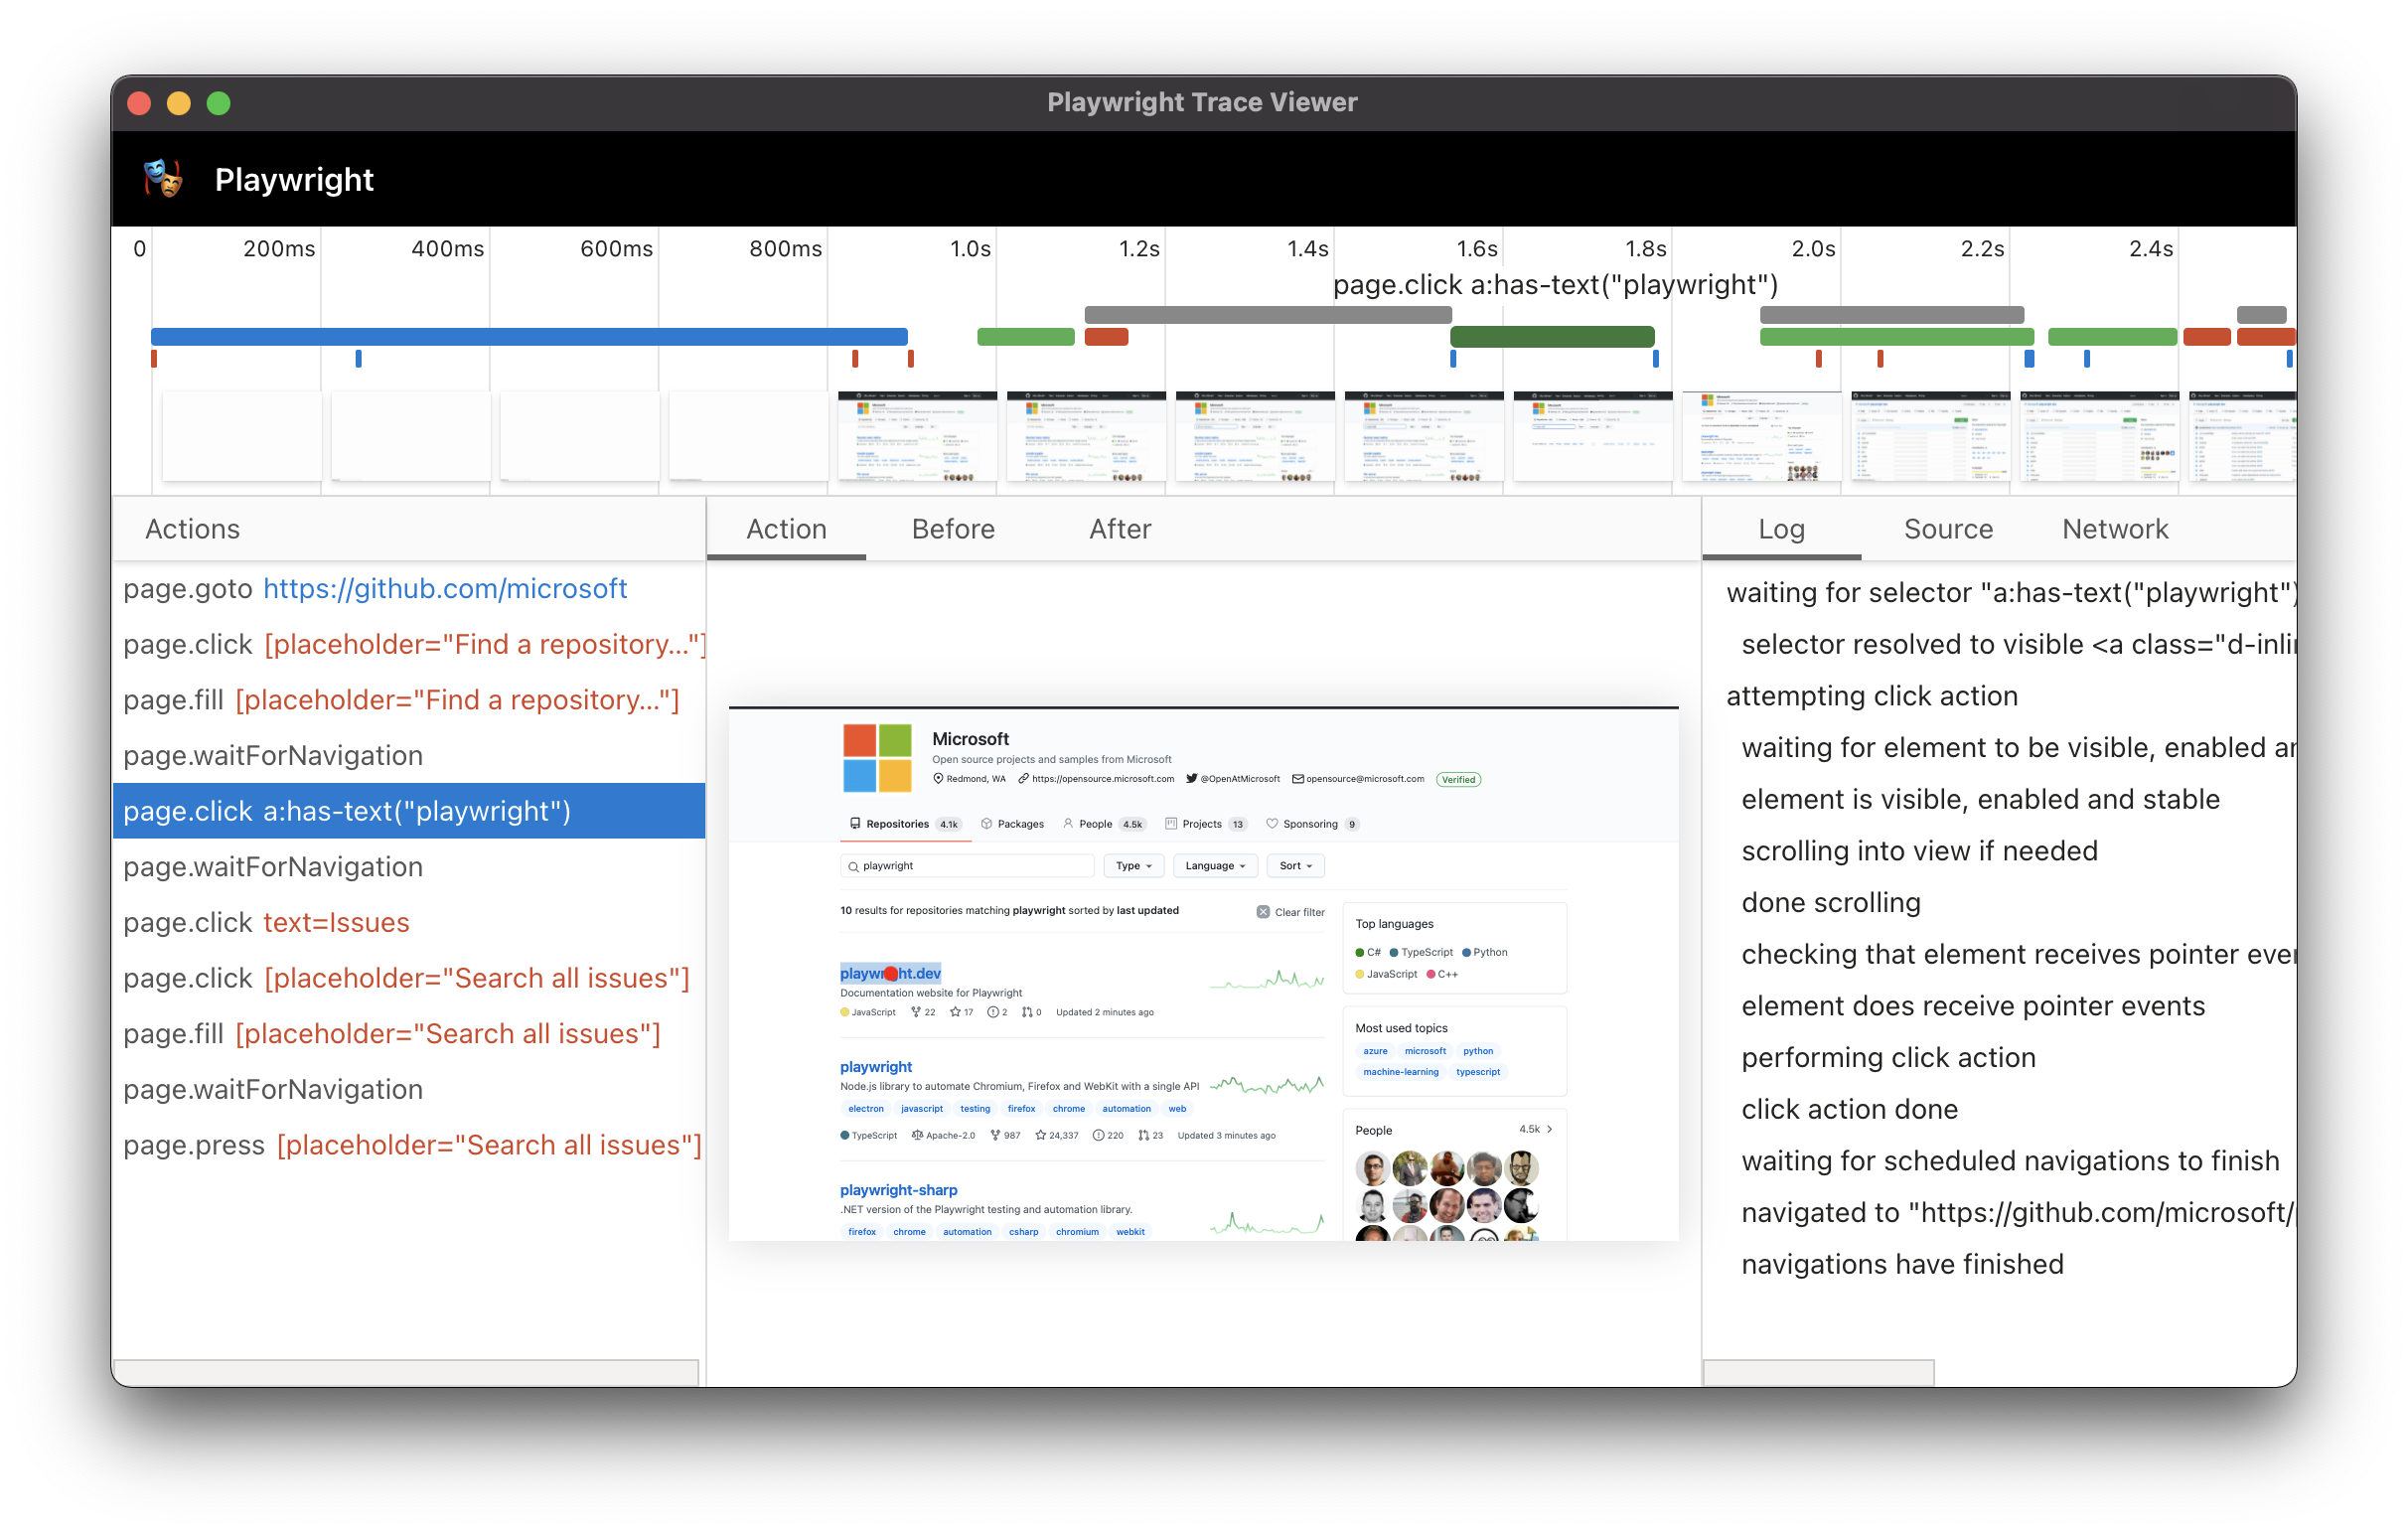
Actions
Once trace is opened, you will see the list of actions Playwright performed on the left hand side:

Selecting each action reveals:
- action snapshots,
- action log,
- source code location,
- network log for this action
in the properties pane. You will also see rendered DOM snapshots associated with each action.
Screenshots
When tracing with the [option: screenshots] option turned on, each trace records screencast and renders it as a film strip:

You can hover over the film strip to see a magnified image:
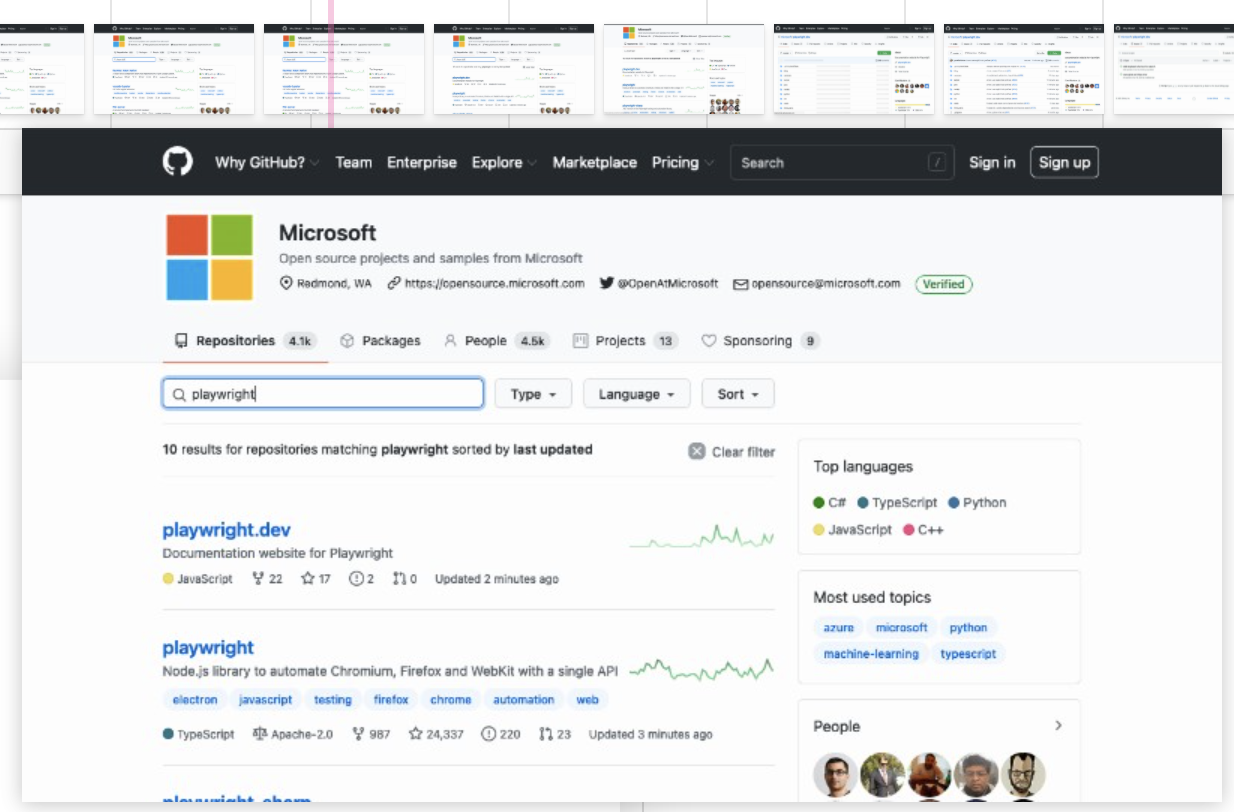
That helps locating the action of interest very quickly.
Snapshots
When tracing with the [option: snapshots] option turned on, Playwright captures a set of complete DOM snapshots for each action. Depending on the type of the action, it will capture:
| Type | Description |
|---|---|
| Before | A snapshot at the time action is called. |
| Action | A snapshot at the moment of the performed input. This type of snapshot is especially useful when exploring where exactly Playwright clicked. |
| After | A snapshot after the action. |
Here is what the typical Action snapshot looks like:

Notice how it highlights both, the DOM Node as well as the exact click position.