7.2 KiB
| id | title |
|---|---|
| trace-viewer | Trace Viewer |
Playwright Trace Viewer is a GUI tool that helps exploring recorded Playwright traces after the script ran. Open traces locally or in your browser on trace.playwright.dev.

Recording a trace
- langs: js
Set the trace: 'on-first-retry' option in the test configuration file. This will produce trace.zip file for each test that was retried.
// @ts-check

/** @type {import('@playwright/test').PlaywrightTestConfig} */
const config = {
  retries: 1,
  use: {
    trace: 'on-first-retry',
  },
};

module.exports = config;
import { PlaywrightTestConfig } from '@playwright/test';
const config: PlaywrightTestConfig = {
  retries: 1,
  use: {
    trace: 'on-first-retry',
  },
};
export default config;
const browser = await chromium.launch();
const context = await browser.newContext();

// Start tracing before creating / navigating a page.
await context.tracing.start({ screenshots: true, snapshots: true });

const page = await context.newPage();
await page.goto('https://playwright.dev');

// Stop tracing and export it into a zip archive.
await context.tracing.stop({ path: 'trace.zip' });
You can also use trace: 'retain-on-failure' if you do not enable retries but still want traces for failed tests.
Available options to record a trace:
'off'- Do not record a trace.'on'- Record a trace for each test.'retain-on-failure'- Record a trace for each test, but remove it from successful test runs.'on-first-retry'- Record a trace only when retrying a test for the first time.
If you are not using Playwright Test, use the [property: BrowserContext.tracing] API instead.
Recording a trace
- langs: java, csharp, python
Traces can be recorded using the [property: BrowserContext.tracing] API as follows:
Browser browser = browserType.launch();
BrowserContext context = browser.newContext();

// Start tracing before creating / navigating a page.
context.tracing().start(new Tracing.StartOptions()
  .setScreenshots(true)
  .setSnapshots(true)
  .setSources(true));

Page page = context.newPage();
page.navigate("https://playwright.dev");

// Stop tracing and export it into a zip archive.
context.tracing().stop(new Tracing.StopOptions()
  .setPath(Paths.get("trace.zip")));
browser = await chromium.launch()
context = await browser.new_context()

# Start tracing before creating / navigating a page.
await context.tracing.start(screenshots=True, snapshots=True, sources=True)

await page.goto("https://playwright.dev")

# Stop tracing and export it into a zip archive.
await context.tracing.stop(path = "trace.zip")
browser = chromium.launch()
context = browser.new_context()

# Start tracing before creating / navigating a page.
context.tracing.start(screenshots=True, snapshots=True, sources=True)

page.goto("https://playwright.dev")

# Stop tracing and export it into a zip archive.
context.tracing.stop(path = "trace.zip")
await using var browser = playwright.Chromium.LaunchAsync();
await using var context = await browser.NewContextAsync();

// Start tracing before creating / navigating a page.
await context.Tracing.StartAsync(new TracingStartOptions
{
  Screenshots = true,
  Snapshots = true,
  Sources = true
});

var page = context.NewPageAsync();
await page.GotoAsync("https://playwright.dev");

// Stop tracing and export it into a zip archive.
await context.Tracing.StopAsync(new TracingStopOptions
{
  Path = "trace.zip"
});
This will record the trace and place it into the file named trace.zip.
Viewing the trace
You can open the saved trace using Playwright CLI or in your browser on trace.playwright.dev.
npx playwright show-trace trace.zip
mvn exec:java -e -Dexec.mainClass=com.microsoft.playwright.CLI -Dexec.args="show-trace trace.zip"
playwright show-trace trace.zip
pwsh bin\Debug\netX\playwright.ps1 show-trace trace.zip
Actions
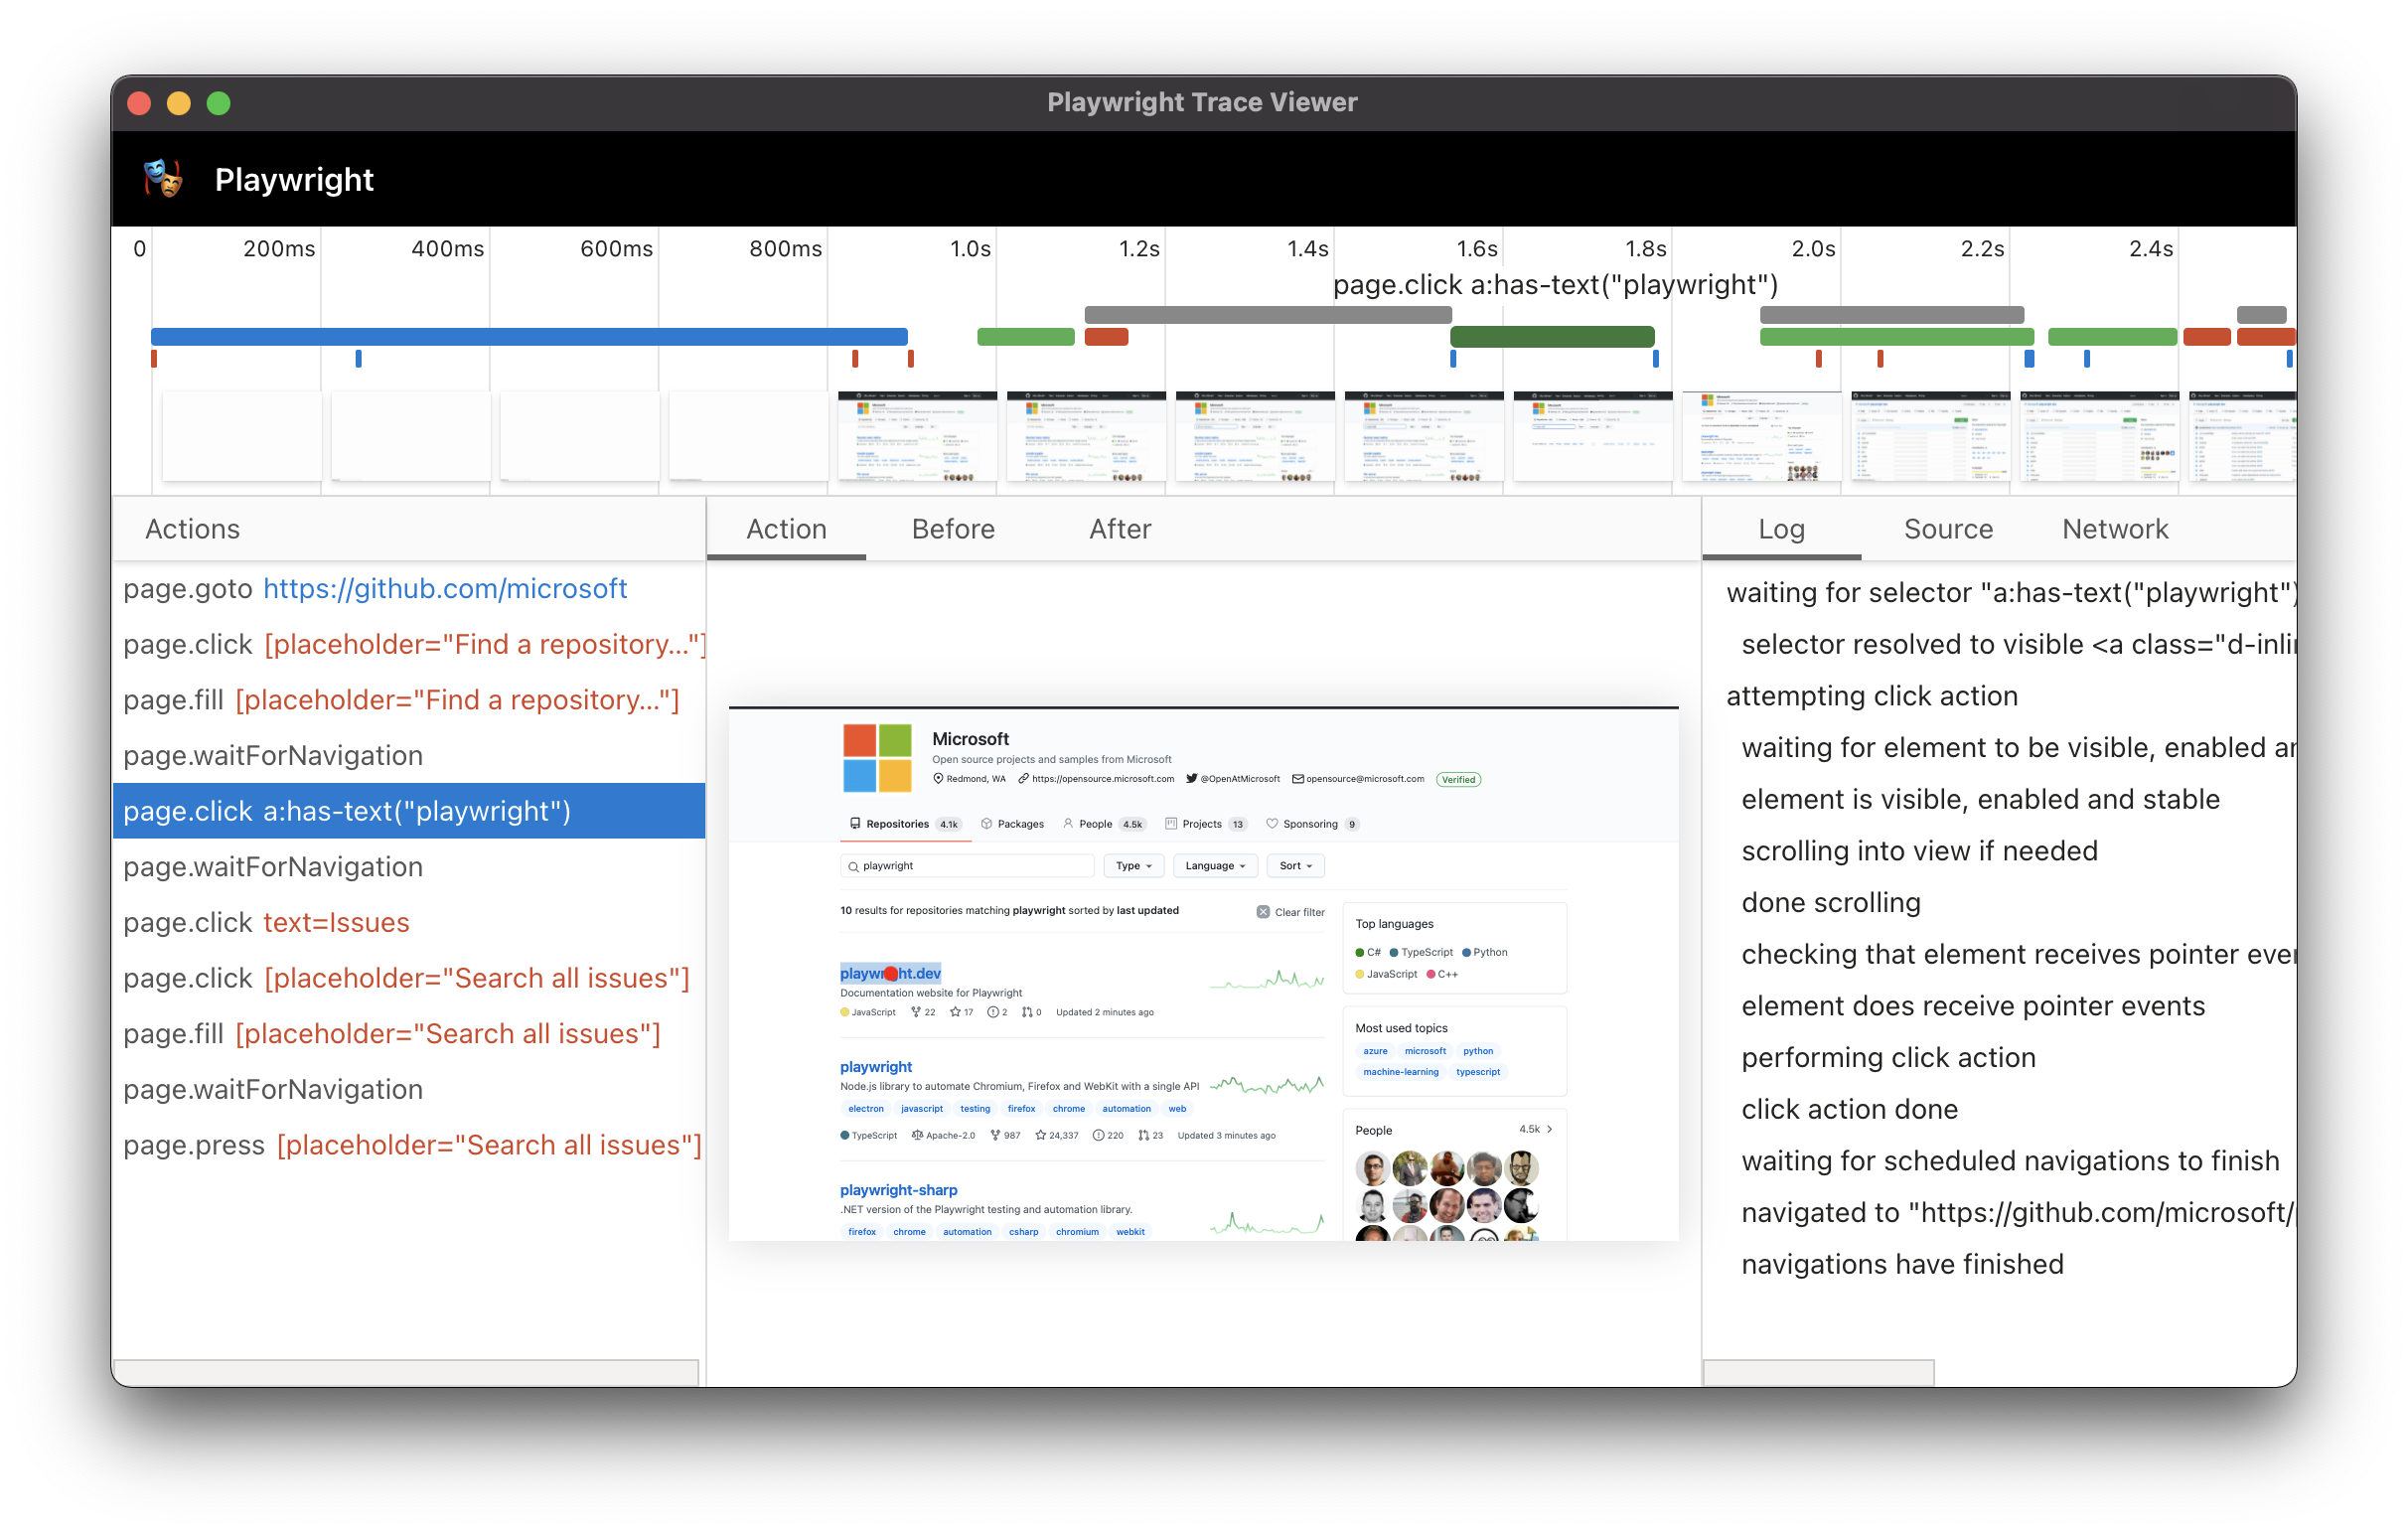
Once trace is opened, you will see the list of actions Playwright performed on the left hand side:

Selecting each action reveals:
- action snapshots,
- action log,
- source code location,
- network log for this action
in the properties pane. You will also see rendered DOM snapshots associated with each action.
Screenshots
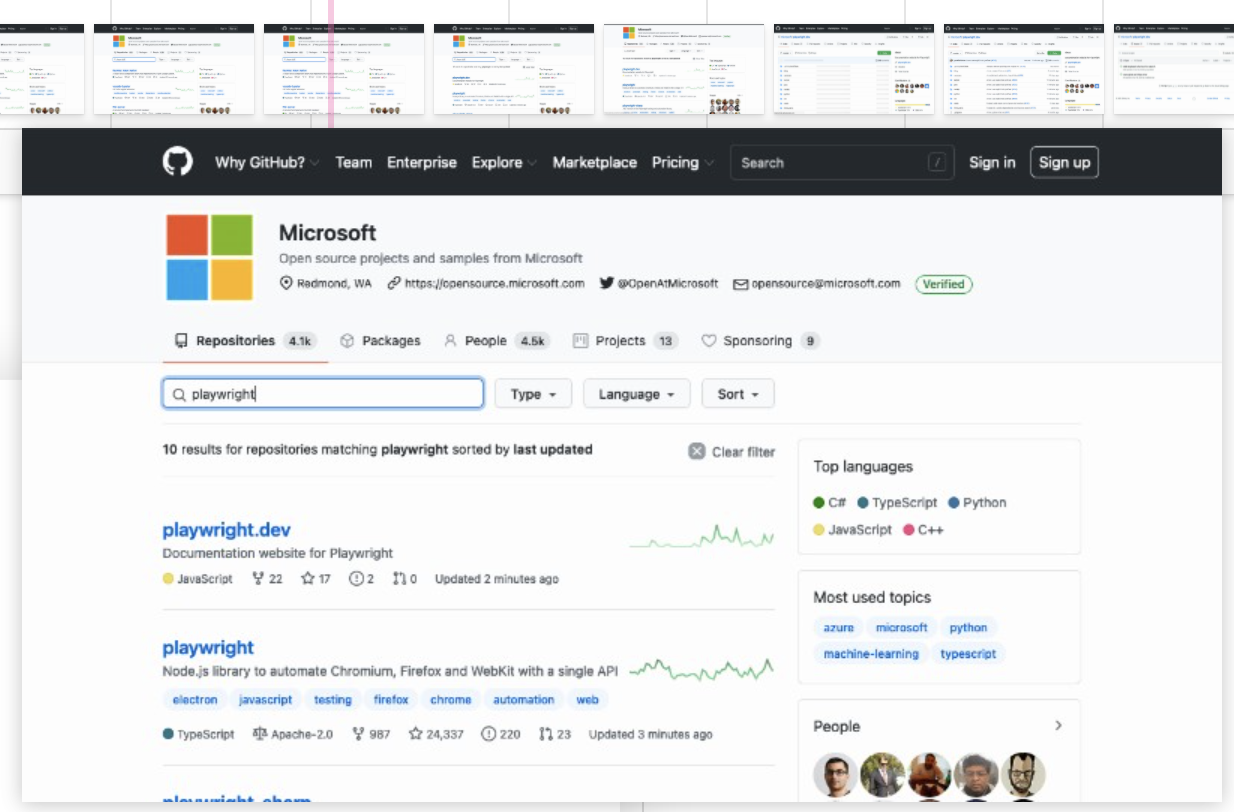
When tracing with the [option: screenshots] option turned on, each trace records screencast and renders it as a film strip:

You can hover over the film strip to see a magnified image:

That helps locating the action of interest very quickly.
Snapshots
When tracing with the [option: snapshots] option turned on, Playwright captures a set of complete DOM snapshots for each action. Depending on the type of the action, it will capture:
| Type | Description |
|---|---|
| Before | A snapshot at the time action is called. |
| Action | A snapshot at the moment of the performed input. This type of snapshot is especially useful when exploring where exactly Playwright clicked. |
| After | A snapshot after the action. |
Here is what the typical Action snapshot looks like:

Notice how it highlights both, the DOM Node as well as the exact click position.
Viewing remote Traces
You can open remote traces using it's URL. They could be generated in a CI run and makes it easy to view the remote trace without having to manually download the file.
npx playwright show-trace https://example.com/trace.zip
mvn exec:java -e -Dexec.mainClass=com.microsoft.playwright.CLI -Dexec.args="show-trace https://example.com/trace.zip"
playwright show-trace https://example.com/trace.zip
pwsh bin\Debug\netX\playwright.ps1 show-trace https://example.com/trace.zip
Using trace.playwright.dev
trace.playwright.dev is a statically hosted variant of the Trace Viewer.
Viewing local traces
When navigating to trace.playwright.dev, you can upload trace files using drag and drop.
Remote traces
You can also pass the URL of your uploaded trace (e.g. inside your CI) from some accessible storage as a parameter. CORS (Cross-Origin Resource Sharing) rules might apply.
https://trace.playwright.dev/?trace=https://demo.playwright.dev/reports/todomvc/data/cb0fa77ebd9487a5c899f3ae65a7ffdbac681182.zip