12 KiB
| id | title |
|---|---|
| debug | Debugging Tests |
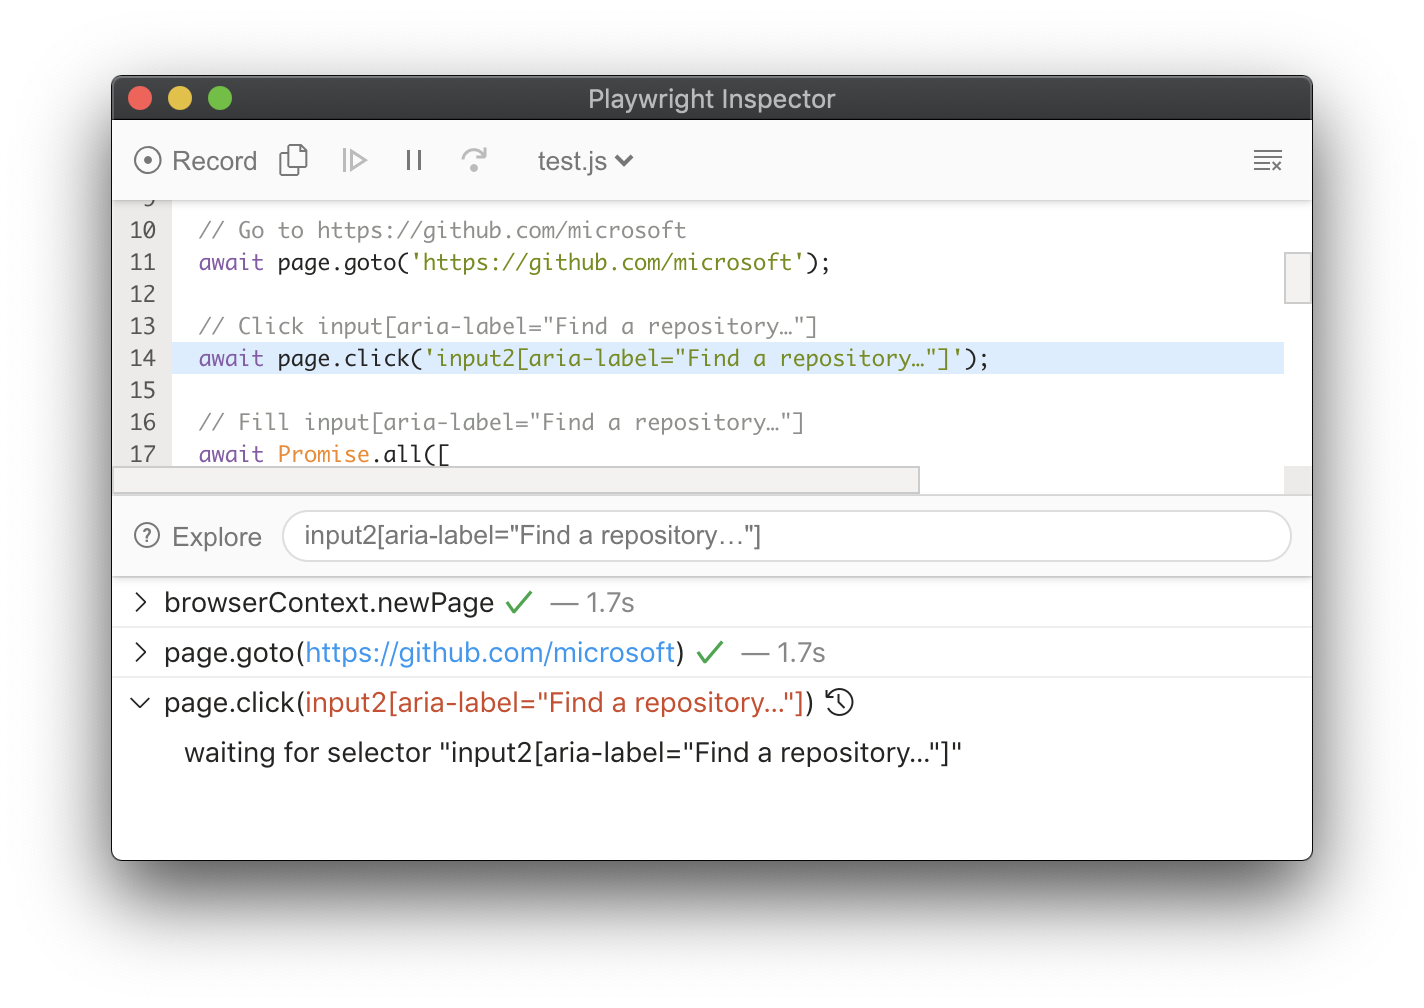
The Playwright inspector is a great tool to help with debugging. It opens up a browser window highlighting the selectors as you step through each line of the test. You can also use the explore button to find other available selectors which you can then copy into your test file and rerun your tests to see if it passes.
Playwright Inspector
Playwright Inspector is a GUI tool that helps authoring and debugging Playwright scripts. That's our default recommended tool for scripts troubleshooting.
There are several ways of opening Playwright Inspector:
Using --debug
- langs: js
-
Debugging all Tests
npx playwright test --debug -
Debugging one test
npx playwright test example --debug
Using PWDEBUG
Set the PWDEBUG environment variable to run your scripts in debug mode. This
configures Playwright for debugging and opens the inspector.
PWDEBUG=1 npm run test
set PWDEBUG=1
npm run test
$env:PWDEBUG=1
npm run test
# Source directories in the list are separated by : on macos and linux and by ; on win.
PWDEBUG=1 PLAYWRIGHT_JAVA_SRC=<java source dirs> mvn test
# Source directories in the list are separated by : on macos and linux and by ; on win.
set PLAYWRIGHT_JAVA_SRC=<java source dirs>
set PWDEBUG=1
mvn test
# Source directories in the list are separated by : on macos and linux and by ; on win.
$env:PLAYWRIGHT_JAVA_SRC="<java source dirs>"
$env:PWDEBUG=1
mvn test
PWDEBUG=1 pytest -s
set PWDEBUG=1
pytest -s
$env:PWDEBUG=1
pytest -s
PWDEBUG=1 dotnet test
set PWDEBUG=1
dotnet test
$env:PWDEBUG=1
dotnet test
Additional useful defaults are configured when PWDEBUG=1 is set:
- Browsers launch in the headed mode
- Default timeout is set to 0 (= no timeout)
Using PWDEBUG=console will configure the browser for debugging in Developer tools console:
- Runs headed: Browsers always launch in headed mode
- Disables timeout: Sets default timeout to 0 (= no timeout)
- Console helper: Configures a
playwrightobject in the browser to generate and highlight Playwright selectors. This can be used to verify text or composite selectors.
PWDEBUG=console npm run test
set PWDEBUG=console
npm run test
$env:PWDEBUG="console"
npm run test
PWDEBUG=console mvn test
set PWDEBUG=console
mvn test
$env:PWDEBUG="console"
mvn test
PWDEBUG=console pytest -s
set PWDEBUG=console
pytest -s
$env:PWDEBUG="console"
pytest -s
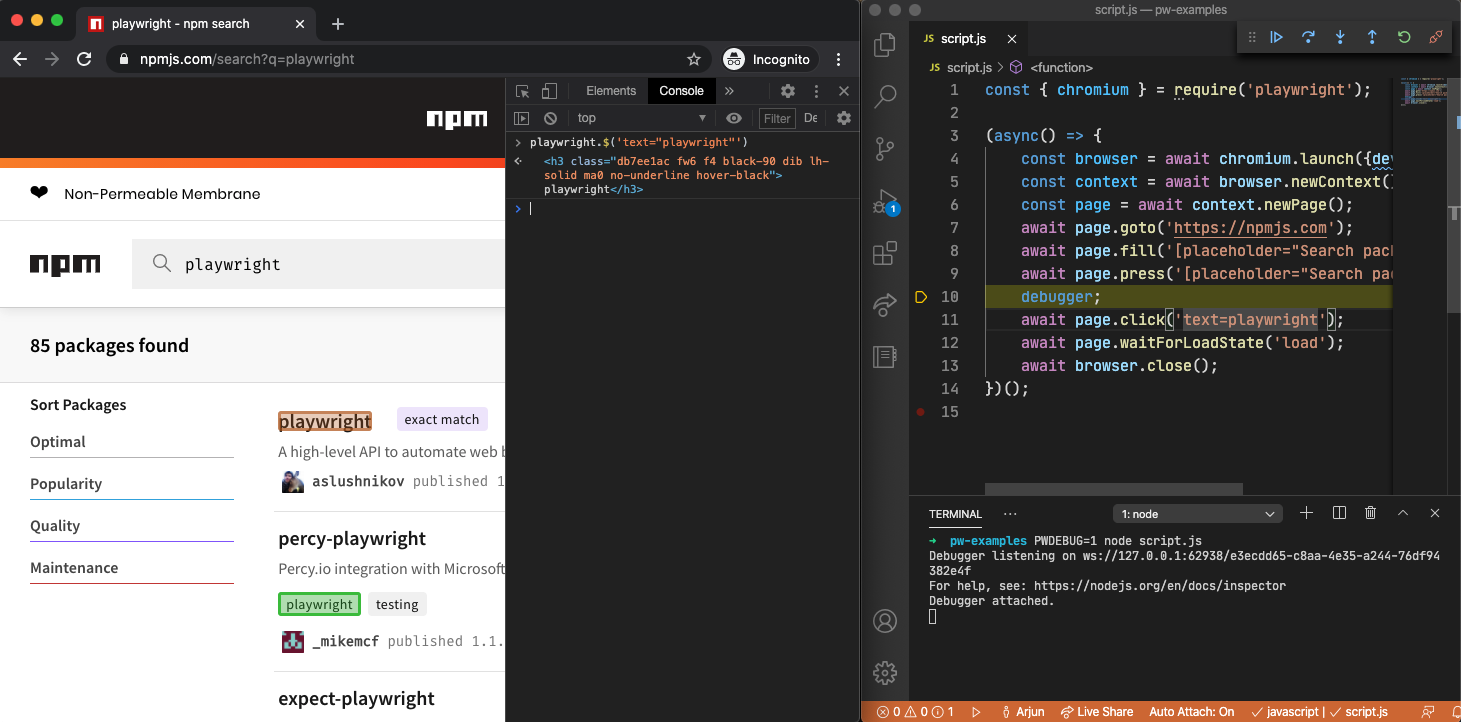
Selectors in Developer Tools Console
When running in Debug Mode with PWDEBUG=console, a playwright object is available in Developer tools console.
- Run with
PWDEBUG=console - Setup a breakpoint to pause the execution
- Open the console panel in browser developer tools
- Use the
playwrightAPIplaywright.$(selector): Highlight the first occurrence of the selector. This reflects howpage.$would see the page.playwright.$$(selector): Highlight all occurrences of the selector. This reflects howpage.$$would see the page.playwright.inspect(selector): Inspect the selector in the Elements panel.playwright.locator(selector): Highlight the first occurrence of the locator.playwright.clear(): Clear existing highlights.playwright.selector(element): Generate a selector that points to the element.
Using page.pause
Call [method: Page.pause] method from your script when running in headed browser.
// Pause on the following line.
await page.pause();
// Pause on the following line.
page.pause();
# Pause on the following line.
await page.pause()
# Pause on the following line.
page.pause()
// Pause on the following line.
await page.PauseAsync();
-
Use
openorcodegencommands in the Playwright CLI:npx playwright codegen wikipedia.orgmvn exec:java -e -Dexec.mainClass=com.microsoft.playwright.CLI -Dexec.args="codegen wikipedia.org"playwright codegen wikipedia.orgpwsh bin\Debug\netX\playwright.ps1 codegen wikipedia.org
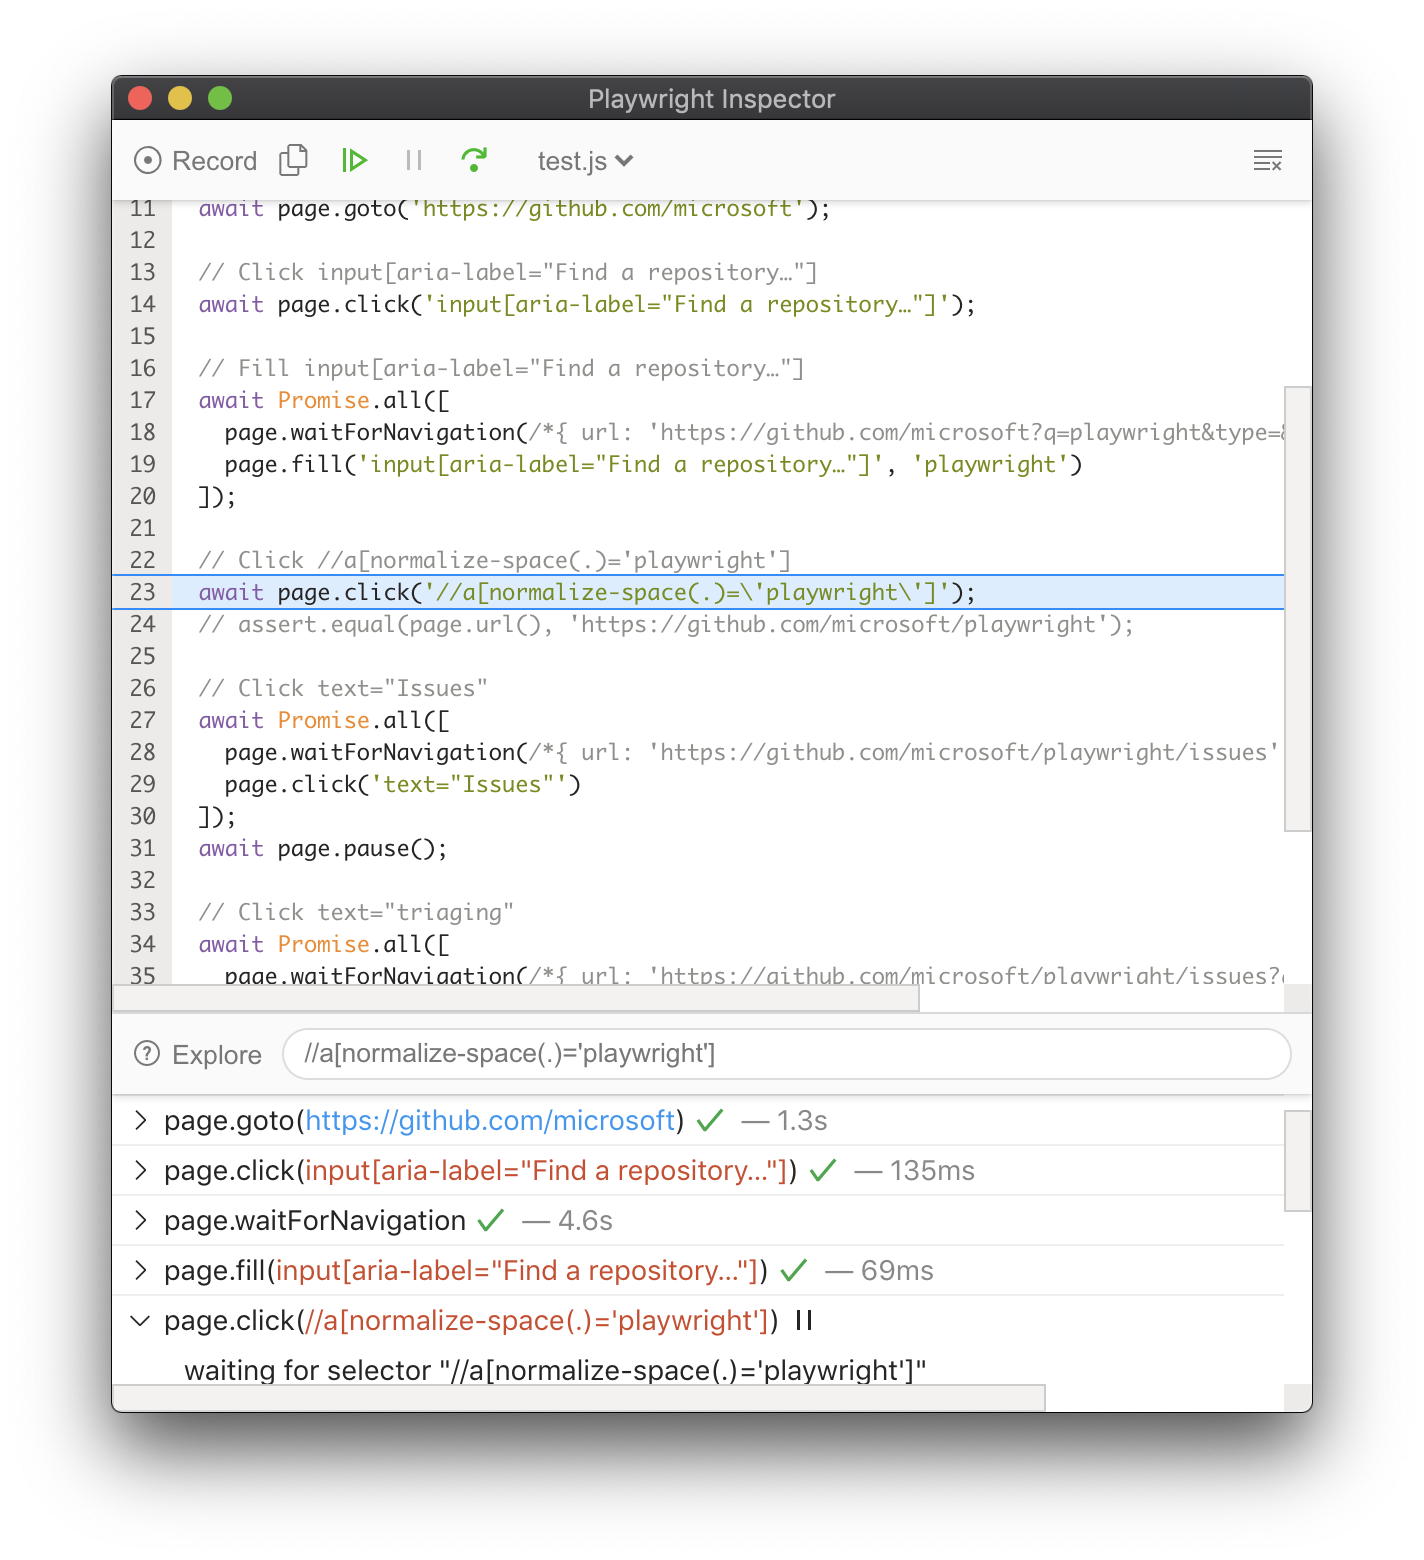
Stepping through the Playwright script
When PWDEBUG=1 is set, Playwright Inspector window will be opened and the script will be
paused on the first Playwright statement:

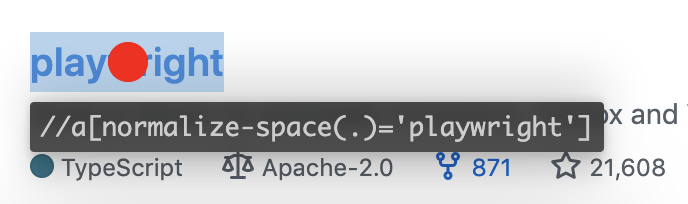
Now we know what action is about to be performed and we can look into the details on that
action. For example, when stopped on an input action such as click, the exact point Playwright is about to click is highlighted with the large red dot on the inspected page:
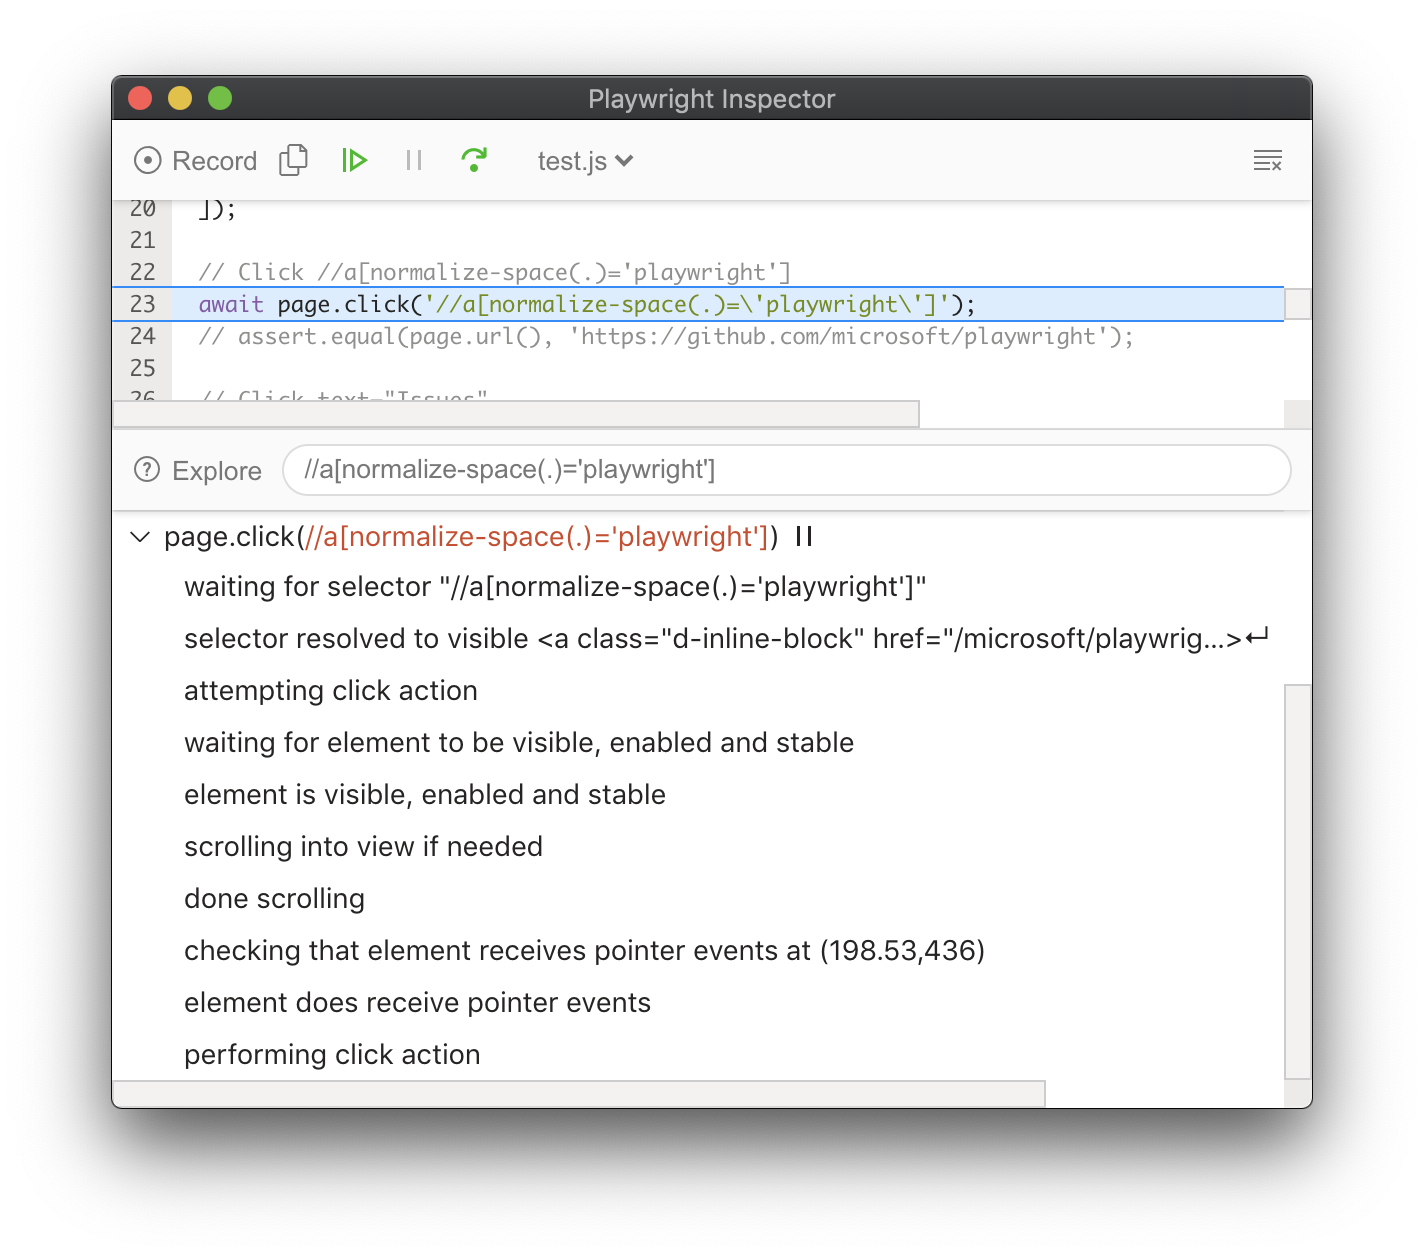
By the time Playwright has paused on that click action, it has already performed actionability checks that can be found in the log:
If actionability can't be reached, it'll show action as pending:
You can step over each action using the "Step over" action (keyboard shortcut: F10) or resume script without further pauses (F8):

Browser Developer Tools
You can use browser developer tools in Chromium, Firefox and WebKit while running a Playwright script in headed mode. Developer tools help to:
- Inspect the DOM tree and find element selectors
- See console logs during execution (or learn how to read logs via API)
- Check network activity and other developer tools features
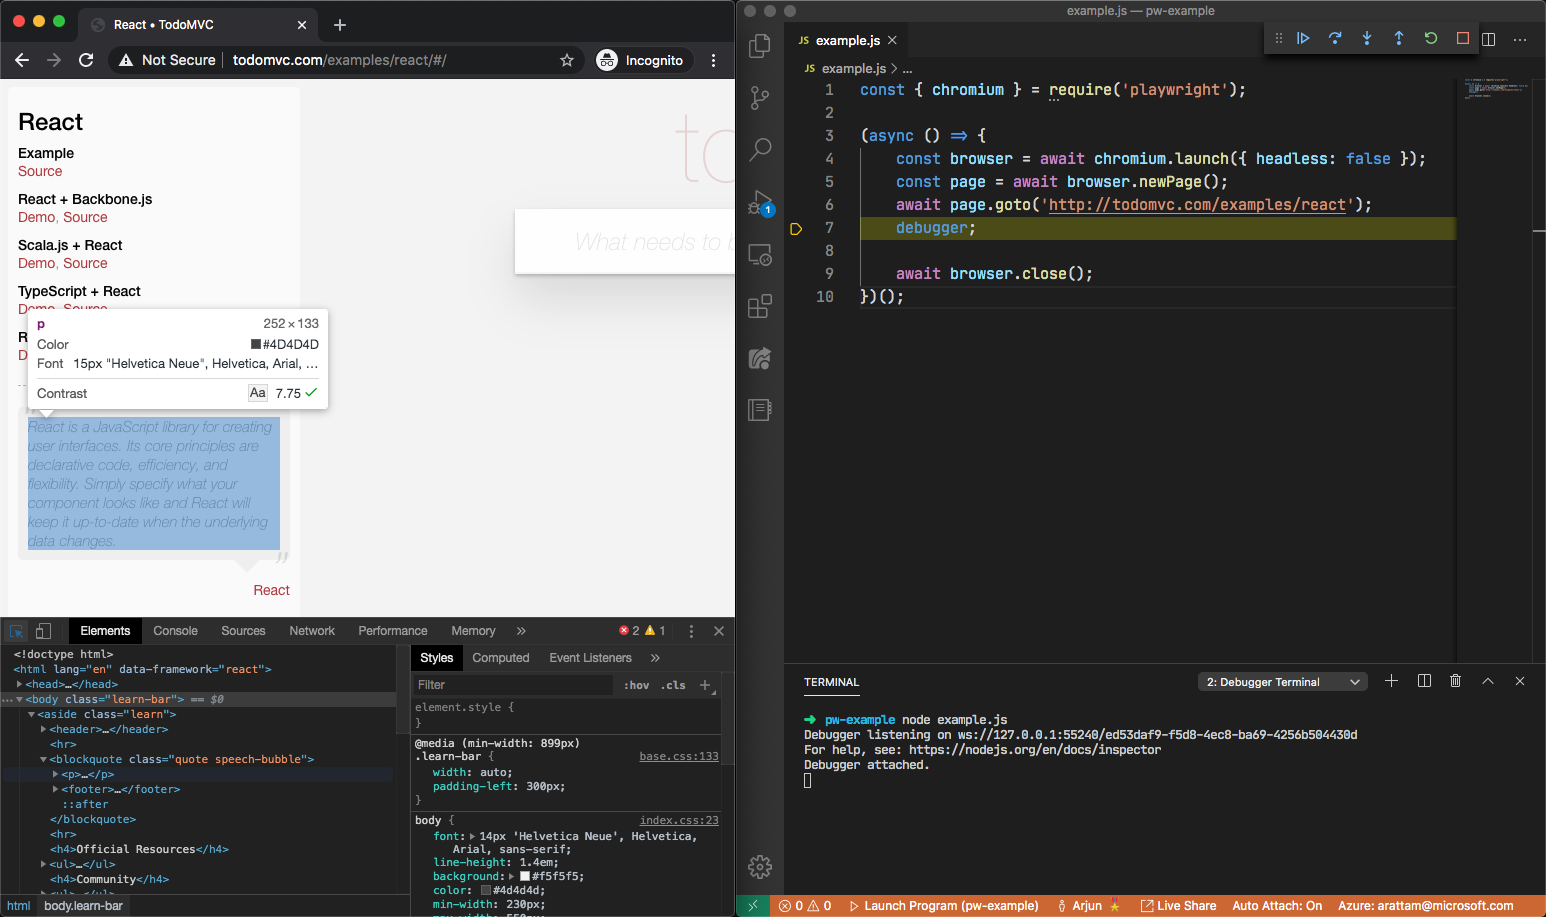
Using a [method: Page.pause] method is an easy way to pause the Playwright script execution
and inspect the page in Developer tools. It will also open Playwright Inspector to help with debugging.
For Chromium: you can also open developer tools through a launch option.
await chromium.launch({ devtools: true });
chromium.launch(new BrowserType.LaunchOptions().setDevtools(true));
await chromium.launch(devtools=True)
chromium.launch(devtools=True)
await using var browser = await playwright.Chromium.LaunchAsync(new()
{
  Devtools: true
});
:::note For WebKit: launching WebKit Inspector during the execution will prevent the Playwright script from executing any further. :::
Debugging Selectors
- Click the Explore button to hover over elements in the screen and click them to automatically generate selectors for those elements.
- To verify where selector points, paste it into the inspector input field:

You can also use the following API inside the Developer Tools Console of any browser.
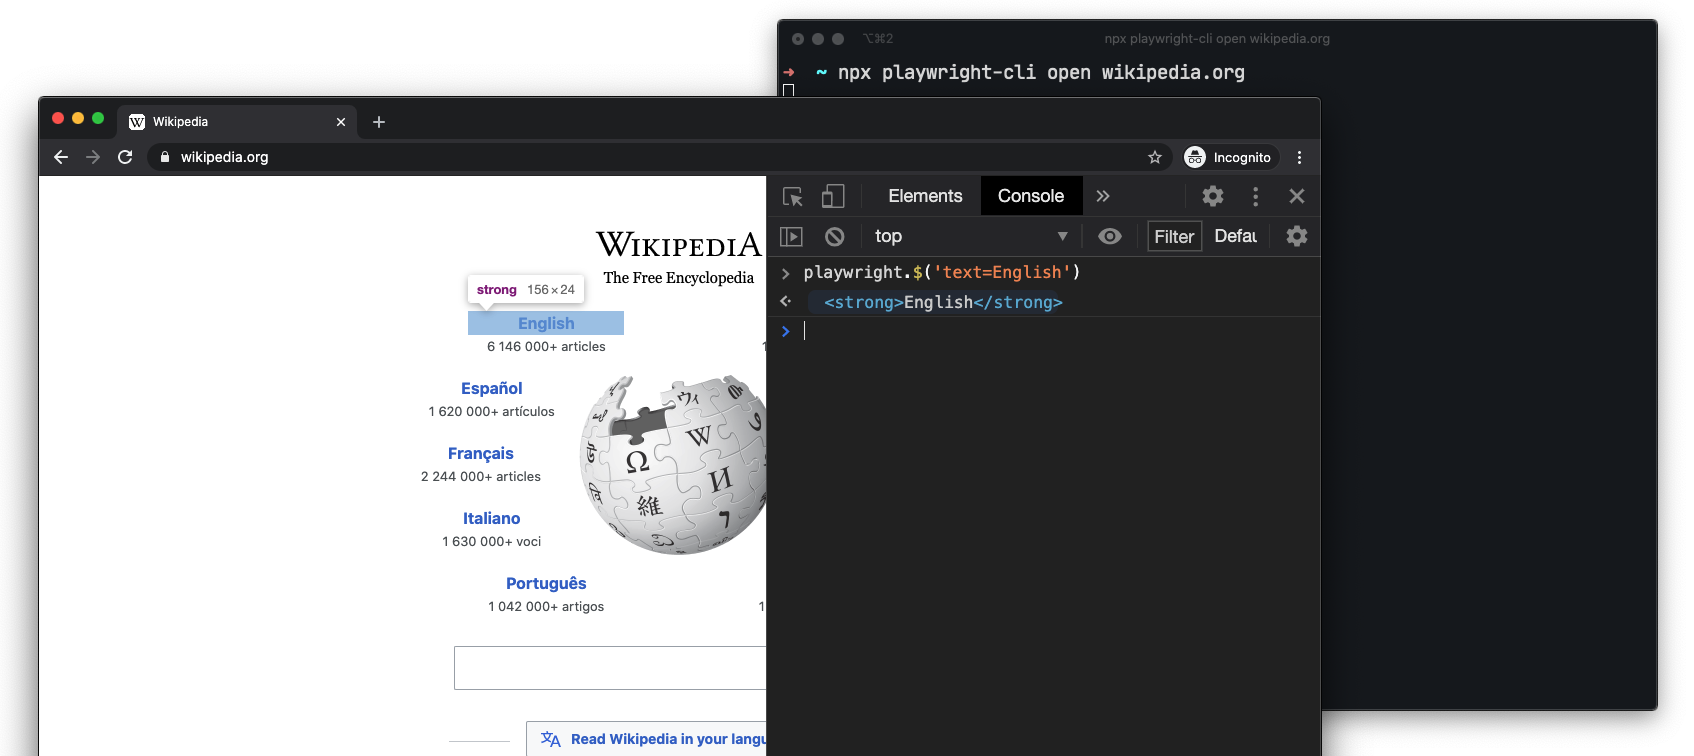
playwright.$(selector)
Query Playwright selector, using the actual Playwright query engine, for example:
> playwright.$('.auth-form >> text=Log in');

<button>Log in</button>
playwright.$$(selector)
Same as playwright.$, but returns all matching elements.
> playwright.$$('li >> text=John')

> [<li>, <li>, <li>, <li>]
playwright.inspect(selector)
Reveal element in the Elements panel (if DevTools of the respective browser supports it).
> playwright.inspect('text=Log in')
playwright.locator(selector)
Query Playwright element using the actual Playwright query engine, for example:
> playwright.locator('.auth-form', { hasText: 'Log in' });

> Locator ()
>   - element: button
>   - elements: [button]
playwright.selector(element)
Generates selector for the given element.
> playwright.selector($0)

"div[id="glow-ingress-block"] >> text=/.*Hello.*/"
Run Tests in headed mode
Playwright runs browsers in headless mode by default. To change this behavior,
use headless: false as a launch option. You can also use the [option: slowMo] option
to slow down execution and follow along while debugging.
await chromium.launch({ headless: false, slowMo: 100 }); // or firefox, webkit
chromium.launch(new BrowserType.LaunchOptions() // or firefox, webkit
  .setHeadless(false)
  .setSlowMo(100));
await chromium.launch(headless=False, slow_mo=100) # or firefox, webkit
chromium.launch(headless=False, slow_mo=100) # or firefox, webkit
// Chromium, Firefox, or Webkit
await using var browser = await playwright.Chromium.LaunchAsync(new()
{
    Headless = false,
    SlowMo = 100
});
Verbose API logs
Playwright supports verbose logging with the DEBUG environment variable.
DEBUG=pw:api npm run test
set DEBUG=pw:api
npm run test
$env:DEBUG="pw:api"
npm run test
DEBUG=pw:api mvn test
set DEBUG=pw:api
mvn test
$env:DEBUG="pw:api"
mvn test
DEBUG=pw:api pytest -s
set DEBUG=pw:api
pytest -s
$env:DEBUG="pw:api"
pytest -s
DEBUG=pw:api dotnet run
set DEBUG=pw:api
dotnet run
$env:DEBUG="pw:api"
dotnet run